

Step by step
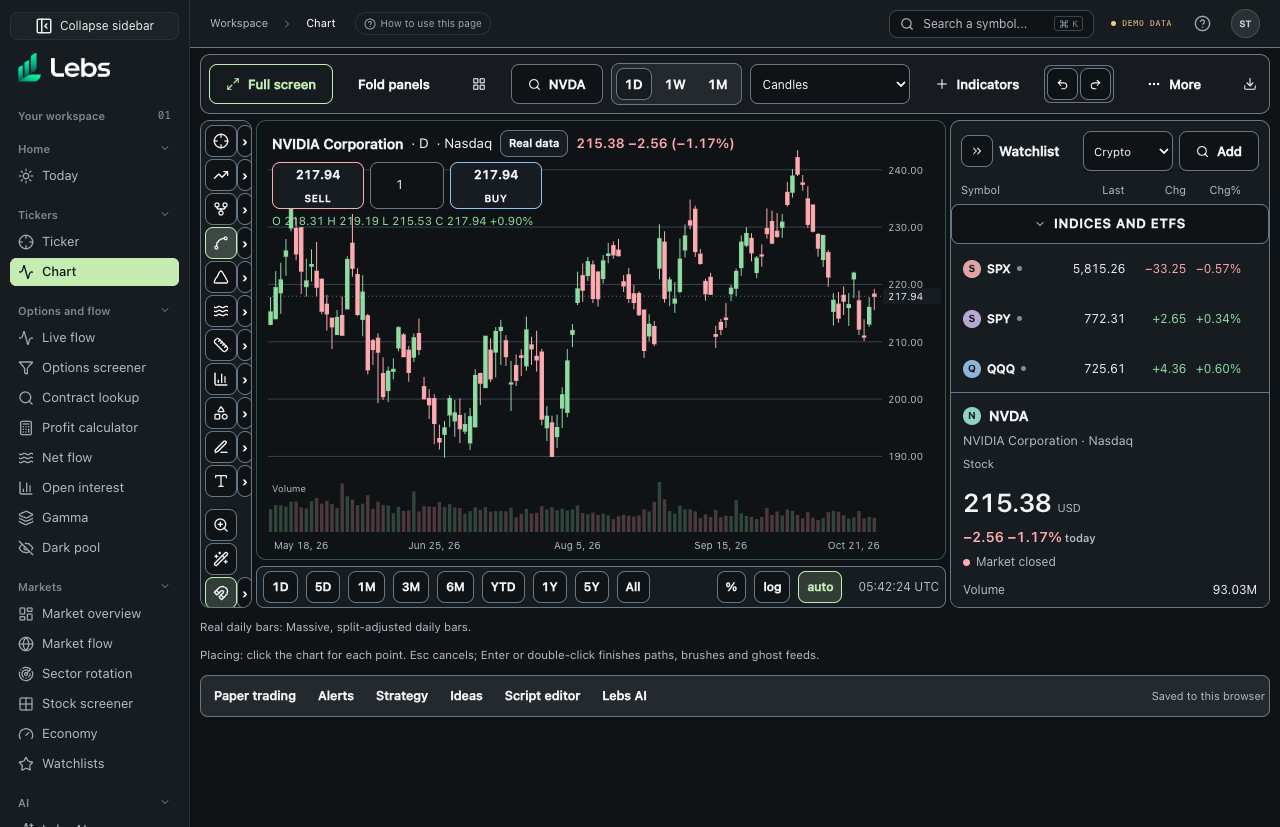
- Open the drawing toolbar on the left side of the chart. Each icon is a group; click the small arrow beside it to see its tools. Fold the toolbar to a thin rail of icons with the « button at its bottom (» opens it again); in full screen it hides and slides out when the pointer reaches the left edge.
- Pick a tool, then click on the chart for each point it needs (a trend line needs two clicks; a pitchfork three). Press Esc to cancel. For paths and brushes, double-click or press Enter to finish. Shortcuts: Alt (Option on a Mac) + T trend line, H horizontal line, V vertical line, C cross line, F Fib retracement.
- Click a finished drawing to select it: drag its handles to adjust, change its color and style, lock it, or delete it.
- Use the magnet to snap points to the nearest open, high, low or close, so lines sit exactly on price.
- Hide all drawings, lock all of them, or keep drawing several in a row with the toggles at the bottom of the toolbar.
- Drawings are saved per symbol and interval, so the lines you draw on the daily chart stay there.
Every control, explained
- Lines
- Trend line, ray (extends one way), extended line (both ways), info line (shows change and angle), trend angle, horizontal line and ray, vertical line, crossline. How: Horizontal lines are the simplest way to mark support (where price has bounced) and resistance (where it has stalled).
- Channels and pitchforks
- Parallel and disjoint channels, regression trend (best-fit line with deviation bands), pitchfork variants (standard, Schiff, modified Schiff, inside), pitchfan, flat top/bottom. How: Draw along a trend to see where price tends to turn inside it.
- Fibonacci
- Retracement, trend-based extension, channel, time zones, speed fan, circles, trend-based time, speed resistance arcs, spiral, wedge. How: Retracement from a swing low to a swing high marks 23.6%, 38.2%, 50%, 61.8% and 78.6% pullback levels many traders watch.
- Gann
- Gann box, fan, square and fixed square. How: Price and time geometry tools from W.D. Gann.
- Patterns
- ABCD, XABCD, Cypher, head and shoulders, triangle, three drives, and Elliott waves (impulse 12345, correction ABC, triangle ABCDE, double and triple combos). How: Click each turning point in order; the tool labels the pattern.
- Cycles
- Cyclic lines, time cycles and sine line. How: Mark repeating time intervals.
- Measure, positions and forecasts
- Measure (change in price, percent and bars), date range, price range, date-and-price range, long and short position (entry, stop and target with reward ÷ risk), position forecast, bars pattern (copy a stretch of bars), ghost feed. How: The long/short position tool is the fastest way to see a trade's risk and reward on the chart.
- Volume tools
- Anchored VWAP, fixed-range volume profile, anchored volume profile. How: Anchor VWAP at an important day (earnings, a low) to see the average price since.
- Shapes
- Rectangle, rotated rectangle, circle, ellipse, triangle, sector, polyline, arc, curve, double curve. How: Box out ranges and zones.
- Brushes and paths
- Path, brush and highlighter. How: Freehand notes.
- Text, notes and markers
- Text, note, price note, pin, callout, comment, price label, signpost, arrows and arrow markers, table, image, icon. How: Write your plan on the chart where you'll see it.
- Cursors
- Cross, dot, arrow, demonstration (a laser pointer for sharing your screen) and eraser (click a drawing to delete it). How: Pick from the bottom of the drawing toolbar.
- Fold the toolbar
- Shrinks the drawing toolbar to a 28-pixel rail of icons, so the chart gets the room. The choice is remembered. How: Click « at the bottom of the toolbar; » opens it again. Tools still work from the rail; open the full toolbar to pick a specific tool from a group.
Tips
- Draw support and resistance on the daily chart before looking at shorter time frames.
- Use the long/short position tool to check reward ÷ risk before every trade.
Common mistakes
- Drawing so many lines that price always touches one.
- Forcing a pattern onto a chart that doesn't really show it.
Limits to know
- Drawings are per symbol and interval; switch intervals and you'll see that interval's drawings.
Try it: On Bitcoin's daily chart, draw a Fibonacci retracement from the lowest low to the highest high of the last 3 months and note where price is now.
Lebs is for education and research, not investment advice, and it places no orders.