

Step by step
- The standalone chart uses the workspace below the top bar without a page heading. Fold both side panels for more candle space; the fold state survives reload. Full screen hides the palette until you reach the left edge. Embedded compact charts hide the side panels and toolbar extras.
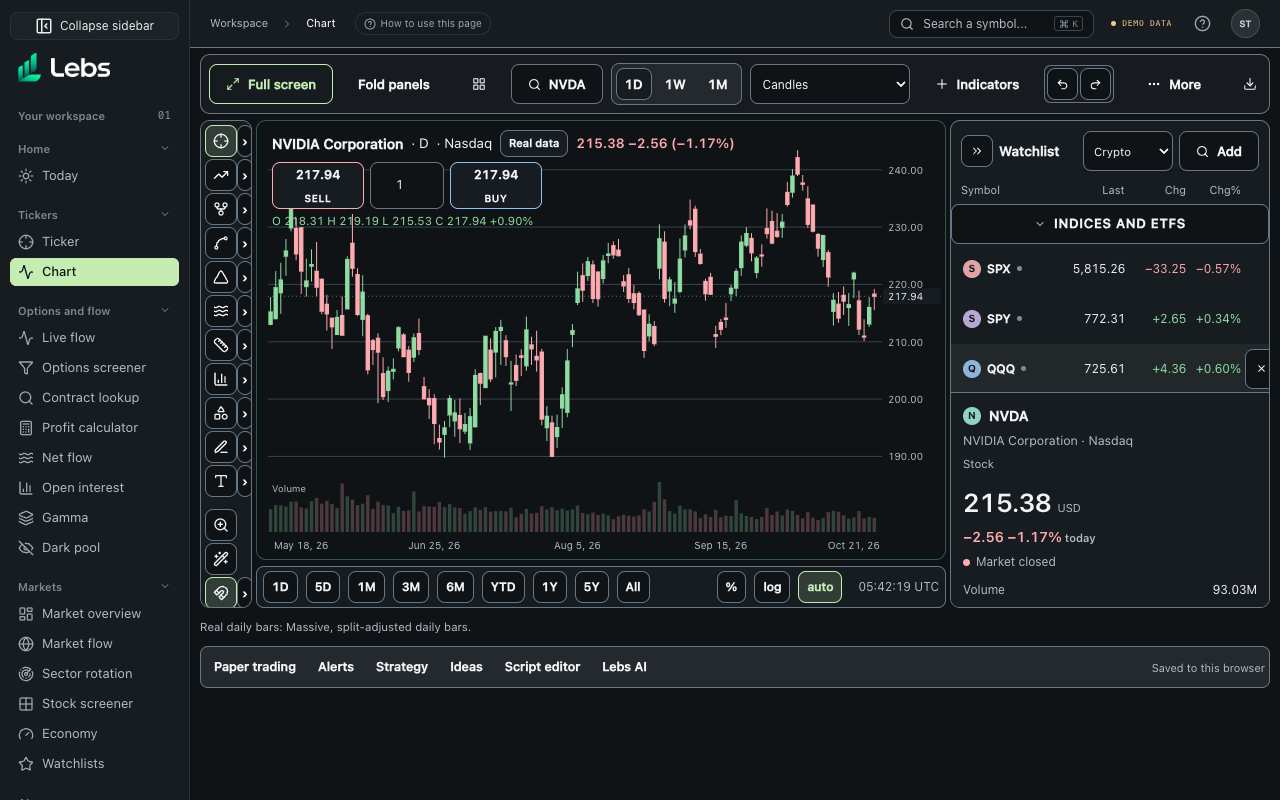
- Open Trading chart. It fills the window under the top bar and resizes with it. The toolbar starts with Full screen and Fold panels, followed by layout, symbol, interval, chart type, Indicators, undo and redo, More and download. It stays on one row; on narrow screens, scroll the toolbar horizontally to reach every control without widening the page. Menus open inside the visible window.
- Use the symbol box to search any of about 12,900 US stocks and ETFs or 17,000 coins; press Enter to load one.
- Read the candles. Each candle is one period (one day by default). The body runs from the opening price to the closing price; the thin lines (wicks) show the highest and lowest prices. Green or hollow means it closed higher than it opened; red or filled means lower.
- Move around: drag the chart left and right to go back in time, scroll (or pinch) to zoom in and out, and drag the price scale on the right up or down to stretch it.
- Change the time frame with the Interval menu (1 minute to 1 month), the range buttons along the bottom (1D, 5D, 1M, 3M, 6M, YTD, 1Y, 5Y, All), or by typing: click the chart, type 15 and press Enter for 15-minute bars, or 1D for daily.
- Open More for the price scale, invert, reset view, bar replay, alerts, a new script, comparing another symbol and gamma levels.
- Hover over the chart: the crosshair shows the date, the open, high, low and close, and the volume for that bar.
- Use the watchlist on the right to switch symbols with one click, and the details below it for the day's range, 52-week range, volume and market status. Fold it to a thin rail with the » button for a wider chart; the rail keeps a badge for each symbol.
- Keyboard: press ? anywhere for the list. On the chart, Alt (Option on a Mac) plus a letter: T trend line, H horizontal line, V vertical line, C cross line, F Fib retracement, A alert, S save image, I invert, P percent scale, L log scale. Press / to open indicators.
- Your layout, drawings and indicators are saved automatically, to your account when signed in. Light, Dark, and System are available in Settings → Display. Candles, grid, crosshair, and chart exports follow that appearance.
Every control, explained
- Symbol search
- Every US-listed stock and ETF plus every coin CoinGecko lists. How: Type a ticker or a name; filter by All, Stocks, ETFs or Crypto.
- Interval
- How much time one bar covers: 1m, 5m, 15m, 30m, 1h, 4h, D (day), W (week), M (month), or a custom value such as 2h or 3D. How: Pick from the menu, type a custom interval under More, or click the chart and type it (5, 60, 1D, 2W) then press Enter.
- Range buttons
- Jump to a time span with a sensible interval, for example 1D shows today in 5-minute bars. How: Click a button along the bottom of the chart.
- Price scale
- Normal, logarithmic (equal percentage moves look equal, best for long histories), percent (change from the first visible bar) or indexed to 100. How: The % and log buttons along the bottom, the scale controls in the More settings sheet, or Alt+P and Alt+L.
- More menu
- The settings you use less often: custom interval, price scale, invert, gamma levels, reset view, bar replay, add an alert, new script, compare. How: Click More at the right of the toolbar to open the settings sheet. Press Escape to close it and return focus.
- Compare
- Draw another symbol on the same chart as a percentage line. How: More, then 'Compare with…'.
- Gamma levels
- The call wall, gamma flip and put wall as labeled dashed lines. Levels outside the visible prices show as a label at the edge with an arrow. How: More opens the settings sheet; tick 'Gamma levels'. For now they're the workspace's sample levels, marked (sample), so they may sit far from a real price.
- Watchlist and details
- Your lists of symbols with live or end-of-day prices, and facts about the current symbol. How: Add symbols with the Add box. The » button folds it to a 40-pixel rail of symbol badges and « opens it again; the choice is remembered.
- Full screen
- The chart takes the whole screen. The drawing toolbar hides and slides out when the pointer reaches the left edge. How: Click Full screen at the start of the toolbar; Esc or Exit full screen leaves. Click Fold panels beside it to collapse the drawing tools and watchlist together; Expand panels restores both.
- Keyboard shortcuts
- Alt (Option on a Mac) plus T, H, V, C or F starts a trend line, horizontal line, vertical line, cross line or Fib retracement; A adds an alert, S saves the image, I inverts, P and L switch percent and log scale. / opens indicators; a typed number then Enter changes the interval; Esc cancels a drawing. How: Click the chart first. Shortcuts don't fire while you're typing in a field. Press ? for the full list.
- Download chart image
- Saves a picture of the chart. How: Click the download button in the toolbar, or Alt+S.
- Undo and redo
- Reverses drawing changes. How: Toolbar arrows.
Reading the numbers
- Open, high, low, close (OHLC)
- The first, highest, lowest and last price in the bar's time period.
- Volume
- How many shares (or, for coins, how many dollars) traded in that period. Big moves on big volume carry more weight.
- Real data / sample prices
- Coins are real (CoinGecko). Stocks are real end-of-day bars from Massive; minute bars are modelled from the daily bar and labelled.
Tips
- Start with daily candles and a 6-month range; it's the clearest view for beginners.
- Use the logarithmic scale for anything longer than a couple of years.
Common mistakes
- Reading minute charts as real tick data: on the free plan they're modelled from daily bars.
- Zooming so far in that every wiggle looks important.
Limits to know
- Stocks: end-of-day prices on the free plan. Intraday bars are simulated and labelled. Coins: about a year of daily history and near-live quotes.
Try it: Open NVDA, set the range to 1Y, switch the price scale to logarithmic, then hover over the biggest candle to read its high and low.
Lebs is for education and research, not investment advice, and it places no orders.