

Step by step
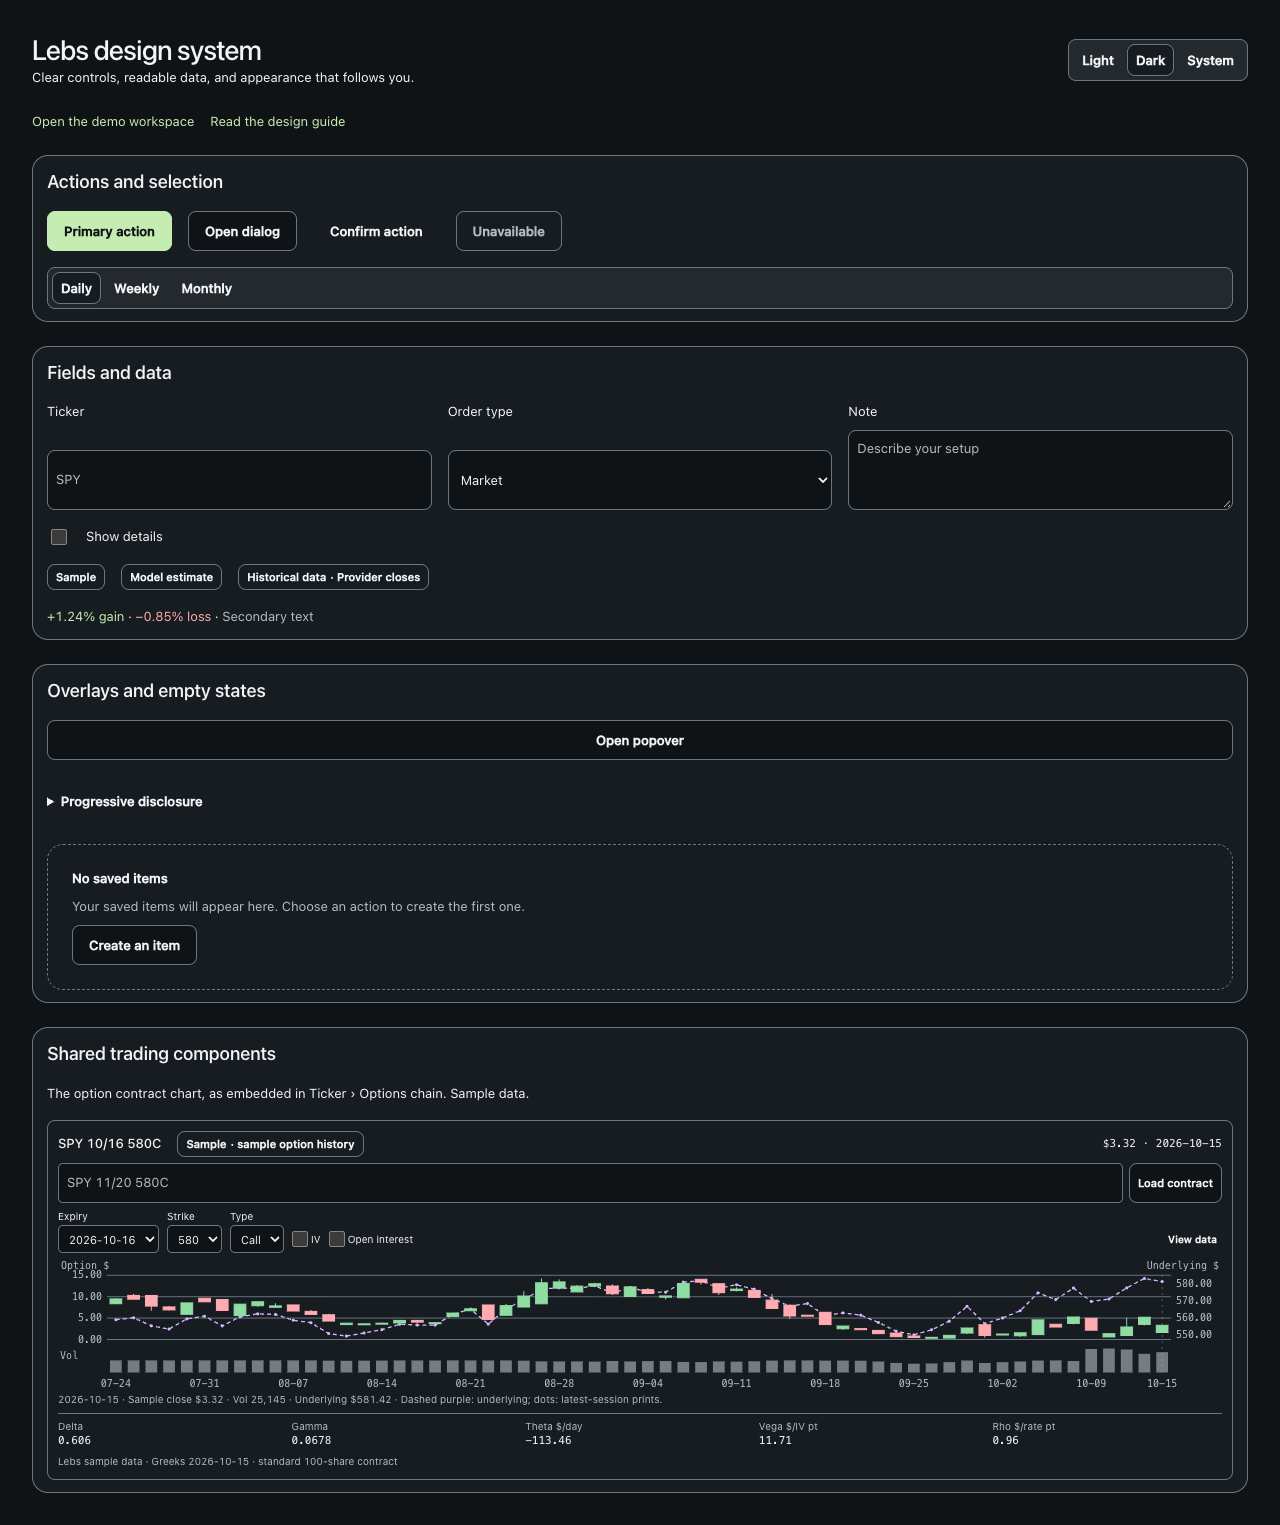
- Open Ticker › Options chain and click a bid or ask, or choose an expiry, strike and Call or Put in the chart. You can also type SPY 11/20 580C in the Contract box and press Enter or Load contract. Dates without a year use the sample session to resolve the next matching date.
- Read the option candles against the left dollar scale and the dashed purple underlying against the right dollar scale. A zero-volume session is a flat, hollow quote marker at the closing mid, not a trade candle. Missing quotes remain blank. Nothing extends past the contract's expiry.
- Turn on IV or Open interest. They use a separate indicator area and independent scales: IV is a percentage and open interest is a contract count. Volume bars below count contracts traded. Dots mark matching sample prints from the latest displayed session.
- Preview it on the Design system page (/design/) under Shared trading components. IV and Open interest are switches; the contract box, menus and View data use the shared controls, and Needs live data appears as an empty state that offers the nearest listed contract. Colors follow Light, Dark or System.
- Hover the chart, or focus it and press Left, Right, Home or End to inspect sessions. Open View data for the exact prices and latest-session prints, then press Escape to close. Read the latest session's snapshot Greeks below the chart.
Every control, explained
- Contract picker
- Expiry, strike and call/put identify a single contract. The text box uses the same parser as Contract lookup. How: Change a picker or type a contract. An unavailable listing offers its nearest listed contract rather than silently changing a typed strike.
- Candles and quotes
- Trade sessions show OHLC candles using the trading chart's own candle drawing. No-trade sessions show the closing mid as a flat quote marker. How: Read the point's kind in the hover readout or data table. No closing mid means no price point; the previous quote is never carried forward.
- Overlay scales
- Underlying price has a second dollar scale. IV and open interest use their own indicator scales, with gaps for missing values. How: Toggle IV and Open interest independently. Compare changes over time; line crossings between different units do not have a numeric meaning.
- Volume and trade dots
- Volume is contracts, not shares. Dots match the symbol, expiry, strike, right and latest displayed session exactly. How: Hover dots for time, size, price and side, or read the print table. Small horizontal offsets only separate dots; they do not represent intraday candles.
- Snapshot Greeks
- Delta and gamma are per option. Theta, vega and rho are dollars per standard 100-share contract: per day, per IV percentage point, and per rate percentage point. How: Check the session date and model assumptions on the source note. A chain from a different session never supplies the displayed Greeks.
Limits to know
- All displayed values are Sample. The sample adapter supplies contract history for its 60 sample sessions ending October 15, 2026. A source without native contract history falls back to a labeled local stub that uses sample prints or a quoted chain mid; those are session snapshots, not full-day market bars.
- It appears in Ticker › Options chain and on the Design system page; Contract lookup does not embed it yet. Unsupported symbols or sources without contract history show Needs live data. A failing native history request never silently falls back to the stub.
- Greeks come from the matching sample-chain snapshot and use its model assumptions. Adjusted contracts, live data, dividends and early exercise need a licensed adapter and explicit contract specifications.
Try it: Load SPY 11/20 580C, enable IV and open interest, open the data table, and compare a trade candle with a flat quote-only point where no sample prints exist.
Lebs is for education and research, not investment advice, and it places no orders.