

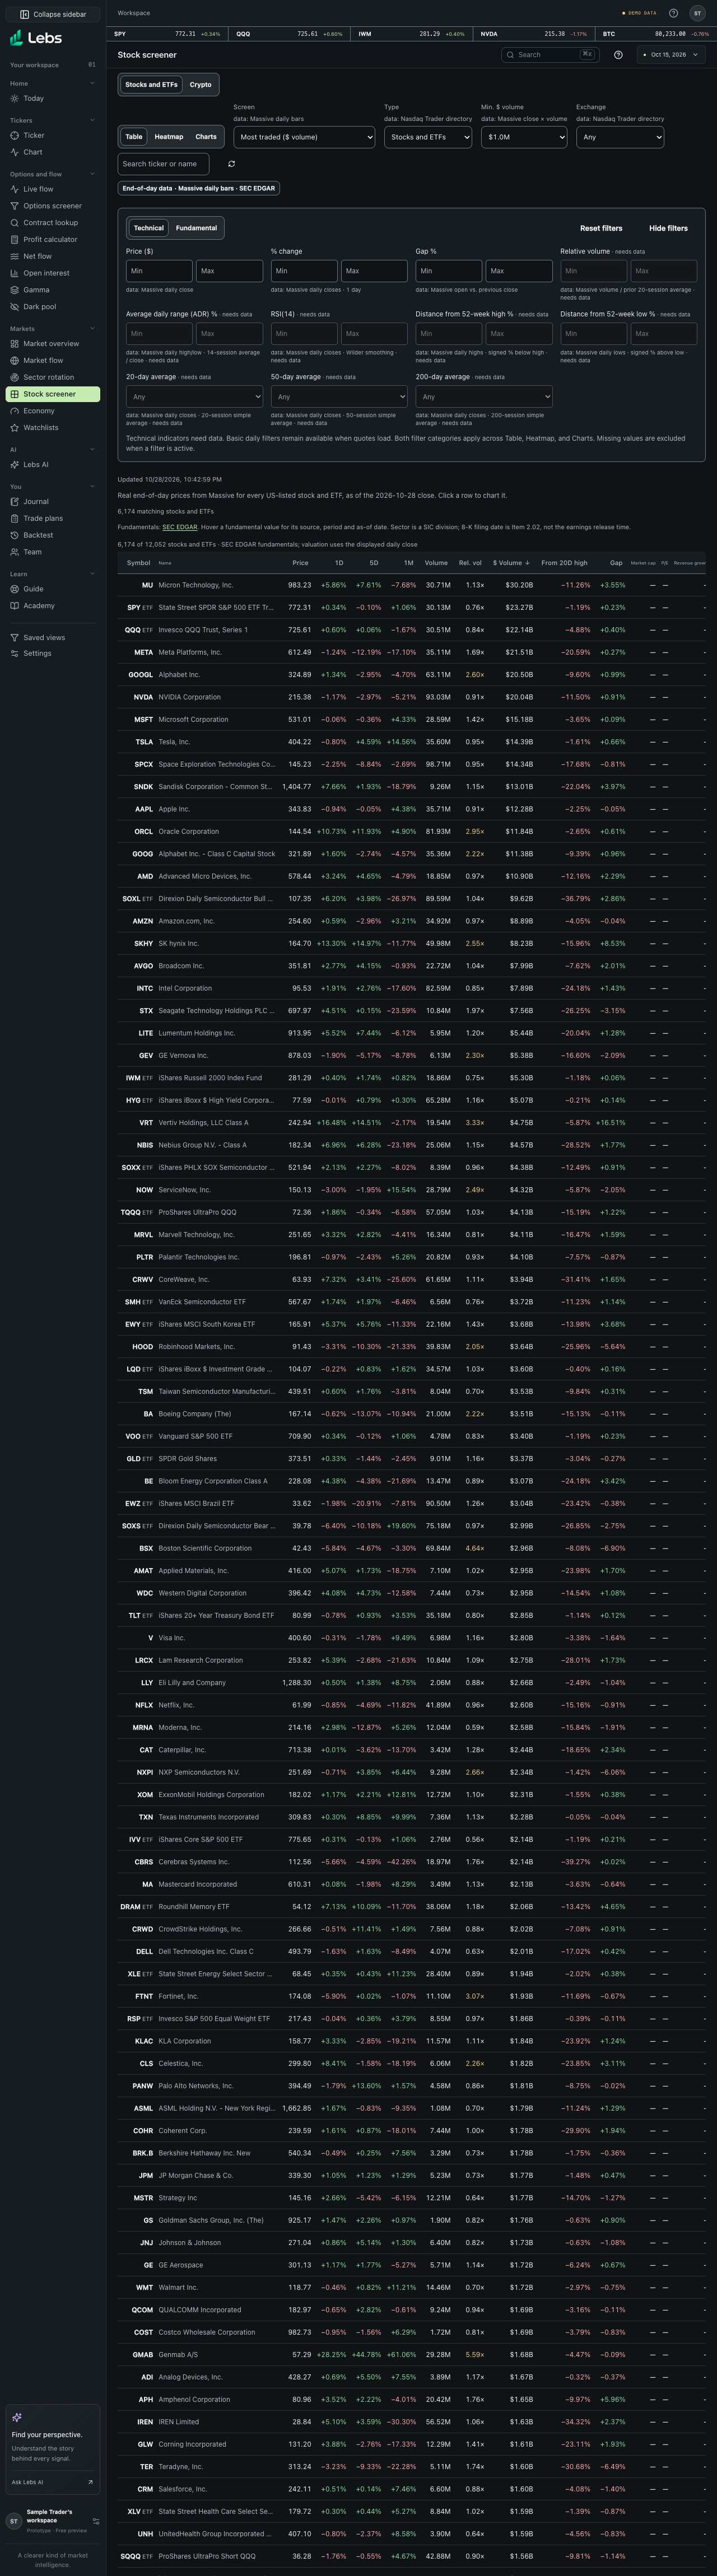
Step by step
- Open Screener and choose Stocks or Crypto at the top.
- Pick a preset. Stocks: most traded, top gainers or losers today, unusual volume (2× normal or more), at or near a 20-day high or low, gapped up or down 2%+ at the open, strongest month. Crypto: all top 250, top gainers or losers in 24 hours, most traded, unusual turnover, strongest week, within 10% of the all-time high, hide stablecoins.
- Narrow it with minimum dollar volume, stocks or ETFs only, exchange, or a name search. Technical and Fundamental tabs organize the stock filters; changing views preserves their selections.
- In Technical, enter optional minimum and maximum values for Price, % change, Gap %, Relative volume, Average daily range (ADR) %, RSI(14), and distance from the 52-week high or low. Choose whether price is above or below its 20-, 50-, or 200-day simple average. All selected filters must match.
- Read each filter's data note. Disabled controls say needs data; newly listed stocks can lack long histories. Nightly indicators must match the price-session date; older indicators never filter newer quotes. Missing values are excluded when a filter is selected.
- Choose Hide filters after setting up a scan to give the results more room. Show filters or either category tab restores the controls without clearing selections.
- Fundamental uses SEC EDGAR for Market cap, P/E, Revenue growth, Sector (SIC division), SEC industry, 8-K filing date and an estimated next earnings date. Data-dependent fields stay disabled until the separately approved backend has loaded them. The next earnings date is estimated from each company's past Item 2.02 filings, not announced by the company.
- Click a column heading to sort by it; click again to reverse.
- Switch to the heatmap to see the whole market as tiles sized by trading value and colored by change; choose the period (1 day, 5 days, 1 month).
- Click any row or tile to open it in the Trading chart.
- Market, View, and filter category are segmented controls: Tab reaches the group, and arrow keys, Home, and End choose another option. The End-of-day data label names Massive daily bars and SEC EDGAR as the sources for every number below it. When nothing matches, Reset filters in the empty state clears the filters and search.
Every control, explained
- Presets
- Ready-made scans for common questions. How: Pick from the menu.
- Filters
- Price, dollar volume, type, exchange, search. How: Combine with any preset.
- Technical
- Numeric minimum/maximum ranges plus above/below 20-, 50-, and 200-session simple moving averages, calculated from Massive daily bars. Price, 1-day change and gap use the current screener snapshot; longer indicators use the same session's nightly metrics. How: Combine ranges; use signed values for distances (for example, -10 to 0 for within 10% of the 52-week high). Above and below exclude equality. Reset filters clears these selections. Hide filters frees room for results while preserving the scan. Invalid ranges show an error and no results.
- Fundamental
- SEC EDGAR shares, diluted trailing EPS and revenue support Market cap, P/E and Revenue growth. Submissions supply SIC division, official SEC industry, the latest Item 2.02 8-K filing date and an estimated next earnings date from those filings' quarterly pattern. How: Combine ranges, Sector, SEC industry and 8-K or next-earnings date bounds. Every note shows SEC EDGAR and its as-of date. Hover table values for source and period (for the estimate, its window). Nonpositive EPS shows n/m. Companies with irregular or too few releases have no estimate.
- Data notes
- The source and calculation window beside each filter. Indicator coverage reports how many symbols have metrics for the displayed session, their loaded daily-session range, and counts with 200-day/52-week data. During backfill, supported indicators are published periodically while longer windows remain unavailable. RSI and other indicators update as older history loads. How: Check these notes before comparing results. Disabled fields do not invent values or substitute sample data.
- Columns (stocks)
- Price, 1-day, 5-day and 1-month change, volume, relative volume, dollar volume, distance from the 20-day high and low, opening gap. How: Sort by any column.
- Columns (crypto)
- Rank, price, 1-hour, 24-hour, 7-day and 30-day change, market cap, volume, turnover, distance from all-time high. How: Sort by any column.
- Heatmap
- Tiles sized by value traded, green for up, red for down. How: Switch view; hover for numbers.
- Charts
- A shared grid of daily candle charts covering the last three calendar months of available history, with 12 symbols per page. Only visible cards load and render candles. How: Choose Charts in Stocks and ETFs. Apply a preset or search, then use Previous and Next. Select a card to open Trading chart.
- Updated
- When the displayed stock result was last successfully fetched. Saved results remain visible during refreshes or provider failures. How: Read Updated together with the price-session date. Refresh requests new data; returning to the screen restores the saved snapshot if browser storage is available.
Reading the numbers
- Relative volume
- Today's volume ÷ the 20-day average. 2× means twice the usual activity.
- ADR %
- The mean daily high-minus-low range over 14 sessions, divided by the latest close and multiplied by 100. It excludes overnight gaps.
- RSI(14)
- A 0–100 momentum measure using 14-session Wilder-smoothed gains and losses. A flat series is 50; uninterrupted gains are 100 and losses are 0.
- 52-week distance
- (Latest close ÷ highest high or lowest low during the last 364 calendar days − 1) × 100. High distances are usually negative; low distances are usually positive. Full-year history is required.
- Dollar volume
- Shares traded × price: how much money changed hands.
- Gap
- Today's open compared with yesterday's close.
- Turnover (crypto)
- 24-hour volume ÷ market cap: how actively a coin trades for its size.
Common mistakes
- Chasing the top gainer after it has already moved a lot.
- Ignoring dollar volume: thinly traded names can be hard to sell.
Limits to know
- Stocks use end-of-day data. Nightly technical metrics require a separately configured backend job and an initial history backfill that can take hours under the shared provider budget. Until it is deployed and loaded, longer-window filters show needs data. Crypto updates every minute.
- SEC fundamentals require separate backend activation. Missing, stale or incompatible quarters remain unavailable; SEC may omit quarterly facts. Sector uses SIC divisions, and Item 2.02 filing dates are not actual release timestamps or next earnings dates.
- The server supplies symbols with valid closes in both latest sessions; a new listing without a prior close is absent. Full-year distances remain empty for shorter histories. Provider corrections and historical split revisions require rebuilding stored daily history.
- A saved result may be stale; Updated is the fetch time, not a live quote time. A first visit still needs a successful market request. Blocked or full browser storage falls back to an in-memory snapshot until reload.
- Charts use the same daily history cache as Trading chart. Provider limits can delay candles even when screener quotes are available. Sample candles are labeled, and crypto open, high and low are approximations from daily prices when this shared grid is reused for coins.
Try it: Run 'Unusual volume (2× normal or more)', sort by relative volume, and open the top name in the chart.
Lebs is for education and research, not investment advice, and it places no orders.