

Step by step
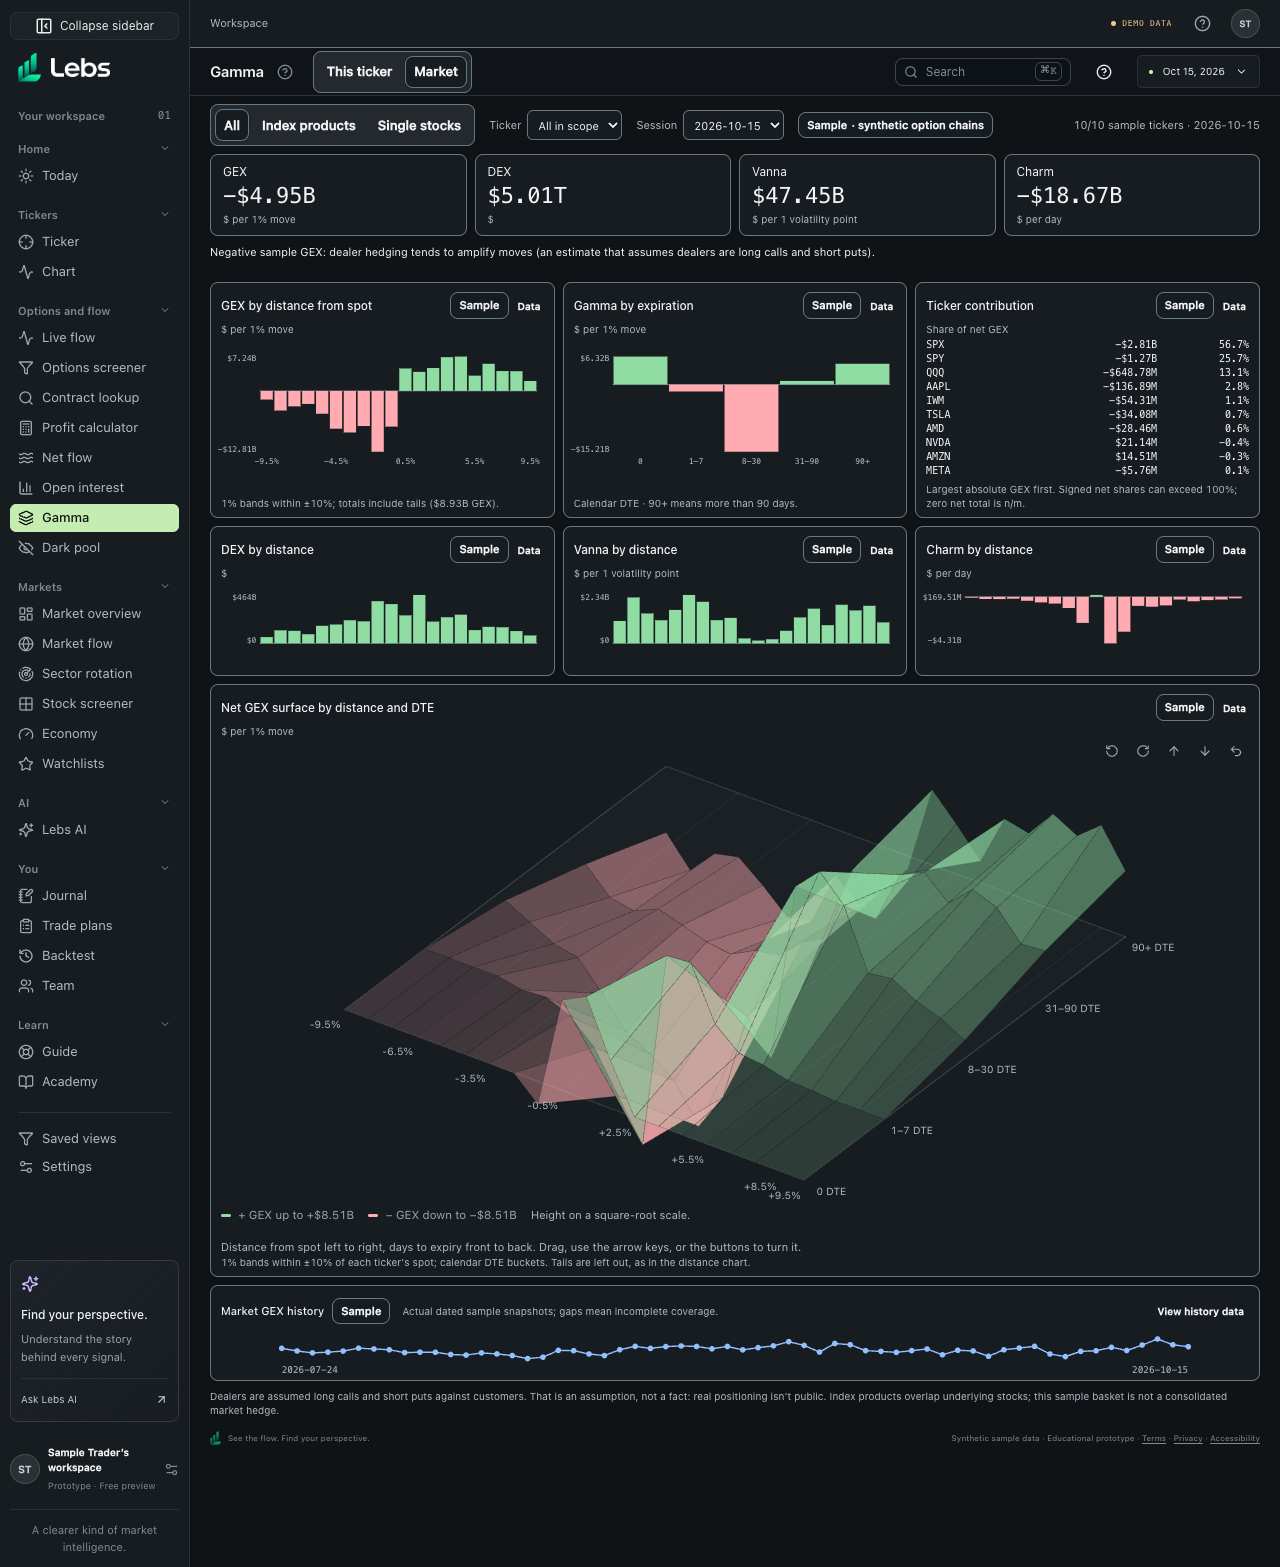
- Open Gamma and select Market in the header. The panel loads the latest sample session first and fills earlier sessions afterwards.
- Choose All, Index products or Single stocks in Exposure scope. Scope is a segmented control: Tab reaches it, and arrow keys, Home and End choose another option. Narrow to one ticker or pick an earlier Session from the menus.
- Read the four totals, then the charts. Several tickers use 1% bands of distance from spot; one ticker uses its real strikes. Positive bars use the theme's gain color and negative bars its loss color in Light and Dark; money values keep their sign.
- Turn the Net GEX surface to see where exposure sits by distance from spot and days to expiry at once. Drag it, use the arrow keys (Shift for bigger steps) or the buttons; Home resets the view. With one ticker it shows real strikes and listed expiries with spot and level lines.
- Every chart has a Sample label and a Data button. Data opens a table of exact values; Escape closes it and returns focus to the button.
Every control, explained
- Exposure scope
- All, Index products (SPX, SPY, QQQ, IWM) or Single stocks define the basket. How: Choose a scope; changing it clears the ticker filter.
- Exposure totals
- GEX ($ per 1% move), DEX ($), vanna ($ per 1 volatility point) and charm ($ per day) summed over the loaded sample chains. How: Read the coverage line for how many tickers loaded. Missing tickers are named; totals then describe the loaded subset only.
- Exposure surface
- Net GEX in 3-D: 1% distance bands left to right, calendar-DTE buckets front to back, height on a square-root scale. Green rises above the floor, red sinks below it. How: Turn it by drag, keyboard or buttons. Data lists every band and bucket value. Strikes beyond ±10% are left out, as in the distance chart.
- Exposure charts
- GEX by strike or distance, gamma by expiration, ticker contribution, the three other Greeks, and a dated GEX history. How: Use Data on any chart for exact values. Gaps in history mean a session had no complete chain snapshot.
Limits to know
- All values are Sample, computed from synthetic option chains. Live market exposure needs a licensed options feed and shows Needs live data until one is connected.
- Dealer positioning is assumed by convention, not observed. Index products overlap their underlying stocks, so the basket is not a consolidated market hedge.
Try it: Select Market, choose Index products, then open Data on Gamma by expiration and compare it with Single stocks.
Lebs is for education and research, not investment advice, and it places no orders.