

Step by step
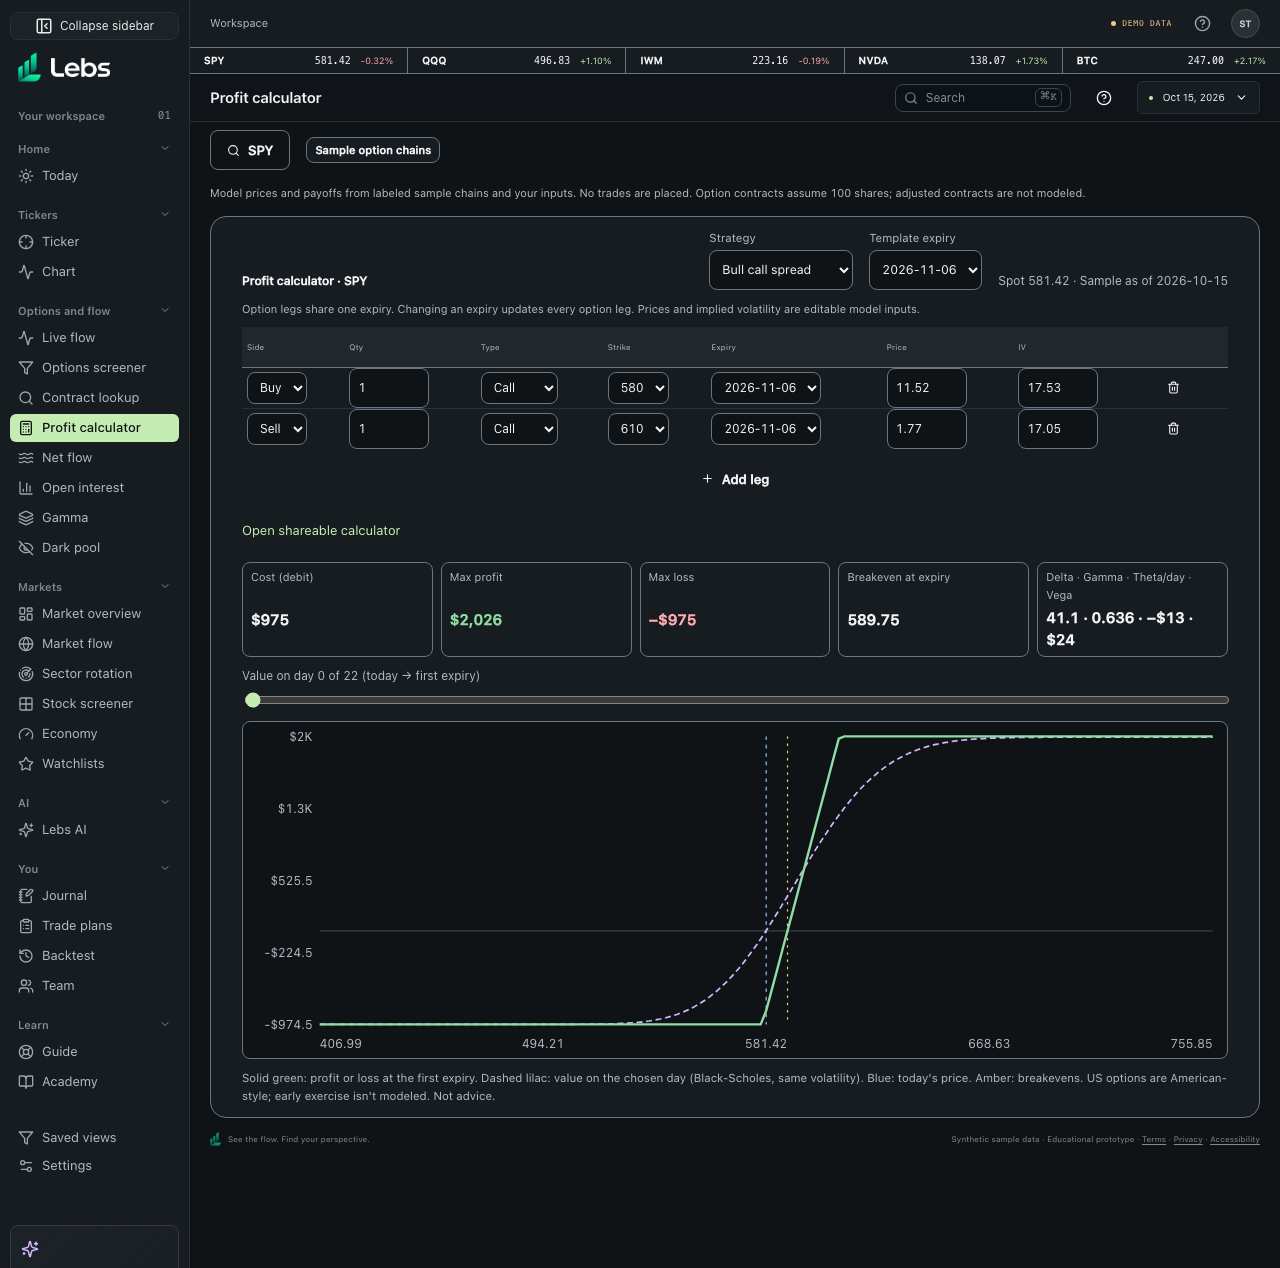
- Open Profit calculator under Options and flow. Choose an underlying in the symbol picker. Supported tickers use labeled sample chains; other symbols show Needs live data.
- Choose a Strategy and Template expiry. Templates replace the current legs with sample mid-price inputs. Edit Side, Quantity, Type, Strike, Expiry, Price and IV, or add and remove legs for a custom strategy.
- Read cost or credit, maximum profit and loss, expiry breakevens and position Greeks. Move the day slider to compare the dashed pre-expiry model curve against the solid expiry payoff. Hover the chart to inspect both values at a price.
- Use Open shareable calculator, then copy the browser URL to share the exact legs and valuation session. Reloading that URL restores the inputs.
- The Sample option chains label covers every price on the page. The payoff chart reads Light, Dark, or System colors from Settings → Display; the green, lilac, blue, and amber meanings stay the same in each appearance. When a symbol has no sample chain, the empty state names the tickers that do.
Every control, explained
- Strategy templates
- The same templates and payoff engine used by Ticker's Options Chain calculator. How: Pick a template and expiry. A template replaces all existing legs; custom changes keep their own prices and IV.
- Custom legs
- Up to eight option or stock legs with editable prices and quantities. Options assume 100 shares per contract. How: Use Add leg and Remove leg. All option legs share one expiry; changing it updates every option leg and reprices known contracts. Shares use a per-share price and no IV.
- Payoff and date slider
- Solid green is expiry payoff; dashed lilac is Black-Scholes value on the selected day. Amber lines mark breakevens; blue marks the sample spot price. How: Drag the slider from the sample valuation date toward expiry. Hover to compare dollar P&L. Greeks remain the position's valuation-date sensitivities, not the selected day's sensitivities.
- Cost, limits and breakevens
- Cost or credit, maximum profit and loss, the expiry breakevens and the position's Greeks. Lebs doesn't show a chance of profit: it describes the payoff, not the odds of a trade working. How: Read the row above the chart; it updates as you edit legs.
- Shareable strategy
- The hash link stores the symbol, valuation date, side, type, quantity, strike, expiry, price and IV of each leg. How: Open shareable calculator and copy the URL. Links are validated before use. A different sample valuation session is rejected with an explanation instead of silently repricing the position.
Limits to know
- Sample chains are not live execution prices. Other tickers need a licensed options feed. Only strategies with one common option expiry are supported; calendar spreads are excluded.
- The model uses European pricing with constant IV, a fixed risk-free rate, and no dividends, commissions or early exercise. US options can be exercised early.
- The chart displays prices within 30% of sample spot. Maximum profit and loss use the full payoff model rather than only that displayed range. Links retain user inputs but do not execute or save an order.
Try it: Choose a bull call spread, change one premium, move the slider, then copy and reopen the strategy link to confirm both legs and prices return.
Lebs is for education and research, not investment advice, and it places no orders.