

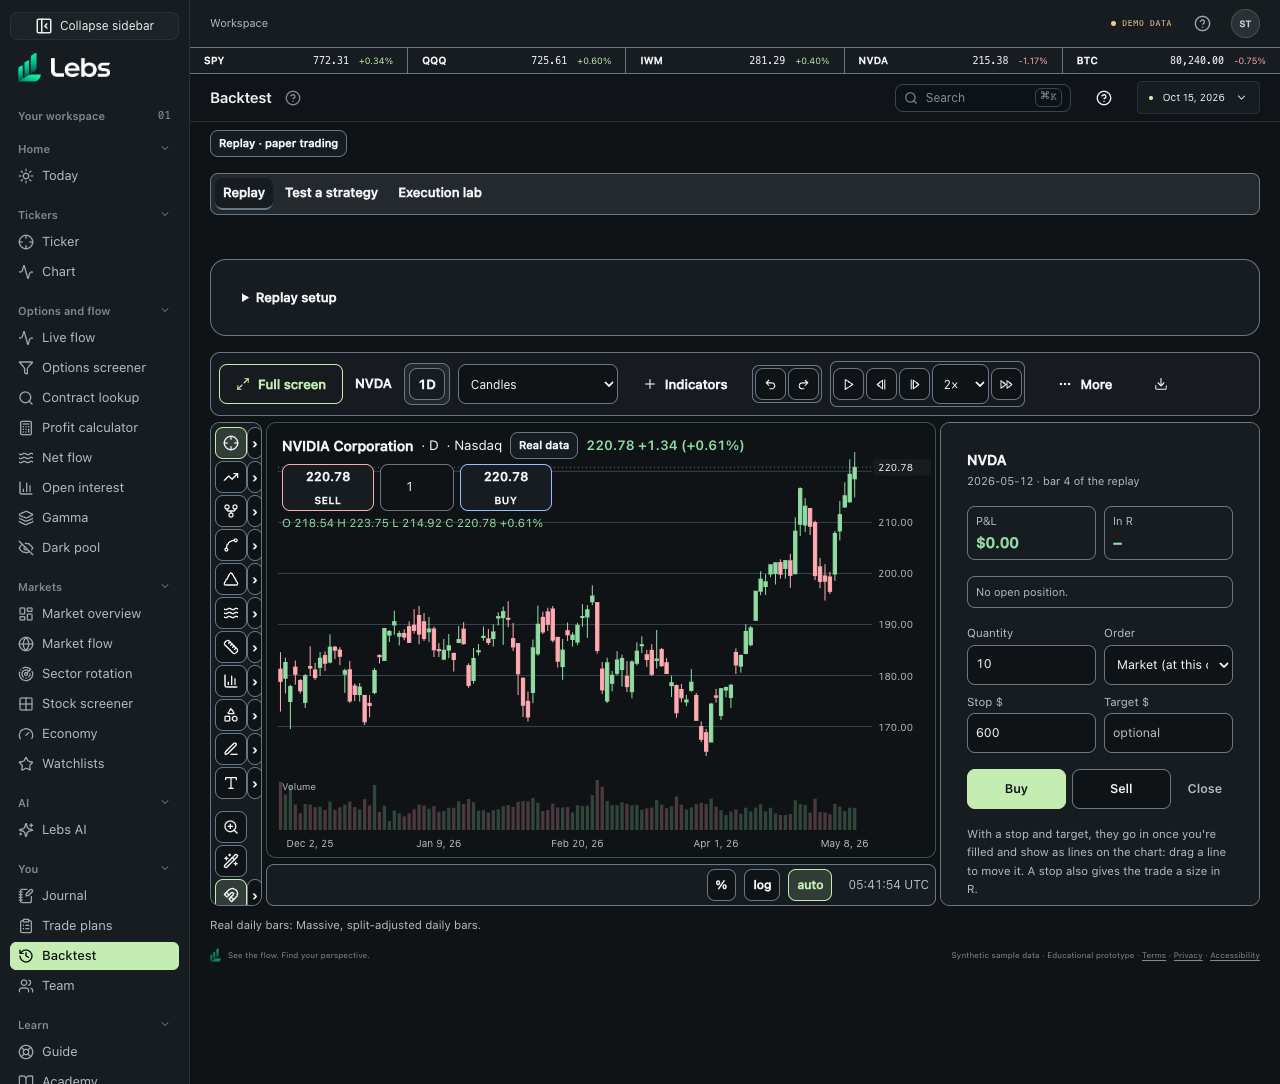
Step by step
- Open Backtest. The Replay sub-tab is where you practice; Test a strategy and Execution lab use the same keyboard-accessible segmented tabs. Replay setup folds after you start so the candles get the space; expand it to choose another date. Controls and chart colors follow Light, Dark, or System in Settings → Display.
- Pick a symbol and a start date (any available real daily session except the final candle, including the first session), then click 'Start the replay'. Or choose 'Random day, name hidden': Lebs picks a real past day for a liquid stock, ETF or coin and hides its name.
- The Trading chart opens on daily candles at that day, with every later candle hidden. Use the replay controls in the toolbar: step forward one bar, play and pause, pick a speed (1×, 2×, 5×, 10×), or jump to the end.
- Trade in the panel on the right. Enter a quantity, choose Market (fills at the current close), Limit or Stop, and optionally a stop and a target. Click Buy or Sell; Close exits the whole position at the current close.
- Once you're in, the stop and target show as dashed lines on the chart. Drag a line to move it. Working orders fill as later candles reach their price.
- Watch the running result: profit or loss in dollars, and in R (multiples of the risk your stop set). The panel also shows the open position and every trade.
- Click 'End session'. Lebs compares your result with simply buying at the last close before the replay and holding to the last candle you saw, and each trade's R with just going long over the same bars. A random day reveals its name.
- Click 'Add these trades to the Journal' to keep them. They're saved under the account 'Backtest' with the tag 'backtest', so they stay separate from real trades in Reports.
Every control, explained
- Replay start
- A symbol and a date, or a random real day with the name hidden. How: Pick them at the top of the Replay sub-tab and click Start. A new start replaces the current session.
- Replay controls
- Step forward, play or pause, speed (1×, 2×, 5×, 10×), and jump to the end to reveal everything. How: In the chart toolbar while a replay runs. Drawing tools, indicators and shortcuts all work as usual.
- Paper trading panel
- Quantity, market, limit and stop orders, an optional stop and target (a bracket), Buy, Sell and Close, working orders with Cancel, the open position and a trade list. How: Docked on the right of the chart. Market orders fill at the current bar's close; others fill when a later bar reaches their price, or at the open if it gaps through.
- Stop and target lines
- Your working stop and target orders, drawn on the chart. How: Drag a line up or down to move that order.
- Running P&L and R
- Profit or loss in dollars, and the total in R for trades that had a stop. How: Updates with every new candle. A trade without a stop has no R.
- Session result
- Your dollars and percent against buying and holding the same candles, trades and winners, and total R against just going long. How: Click 'End session'.
- Add to Journal
- Your closed trades as Journal entries dated on the replayed days, marked as backtest trades. How: After ending the session, click 'Add these trades to the Journal'.
- Test a strategy
- A rule in plain English run on past prices by Lebs AI. How: The second sub-tab; its button opens Lebs AI's backtest.
- Execution lab
- Work a large order with TWAP, VWAP and other algorithms on modeled minute bars, with a cost report, account allocation, baskets and brackets. How: The third sub-tab. Everything is paper only.
Reading the numbers
- R
- A result divided by the risk the stop set. +2R made twice what the stop would have lost.
- Buying and holding
- Putting the whole $100,000 into the symbol at the last close before the replay and keeping it to the last candle you saw. If your trading didn't beat it, the trades didn't add anything.
- Simulated intraday
- Minute and hour bars rebuilt from daily bars, labeled on the chart. They cover only the last 10 days, so older replays stay on daily candles.
Tips
- Decide your stop before you click Buy; it's what makes the result measurable in R.
- Try the same date twice: once trading, once only watching. The difference is your decisions.
- A random day with the name hidden removes what you already know about famous stocks.
Common mistakes
- Jumping to the end before deciding, then trading what you've seen.
- Judging a few sessions: a handful of trades says little, and a rising market makes buying look skillful.
Limits to know
- Paper trades only: no fees, no slippage and no partial fills; market orders fill at the bar's close.
- Stocks are real end-of-day bars on the free data plan; minute bars are simulated from daily bars and labeled. Coins use real daily closes with estimated open, high and low.
- Weekly and monthly bars aren't available in a replay, because a week's candle would show days that hadn't happened yet. Change the interval before your first trade.
- A session isn't saved: end it and add the trades to your Journal to keep them.
- Sample prices cannot start a replay. A date with no candle, such as a weekend, is explained rather than silently shifted to another session. The last available candle cannot be the start because replay needs a later candle.
Try it: Start a random day. Buy 10 shares with a stop 5% below the close and a target 10% above, play at 5×, then end the session and compare your R with just going long.
Lebs is for education and research, not investment advice, and it places no orders.