

Step by step
- The Journal follows Light, Dark, or System in Settings → Display. Its sections use keyboard-accessible segmented tabs, and the Dashboard calendar, charts, filters, and settings share the same controls. Demo records are labeled Sample; personal records remain labeled as your journal entries.
- Add a trade with Log a trade: symbol, shares or an option, long or short, quantity, entry and exit prices and dates, fees, and whether you followed your plan. Pick the playbook and account, and rate how well you executed it.
- Open More details to add the planned stop and up to five profit targets (so Lebs can measure the trade in R), the times you got in and out, and tags for the setup, the mistakes you made and how you felt.
- Or import a CSV from your broker. Lebs recognises two kinds of file: one row per trade, or one row per buy and sell, which it pairs into trades first in, first out. Check the column matches, then import.
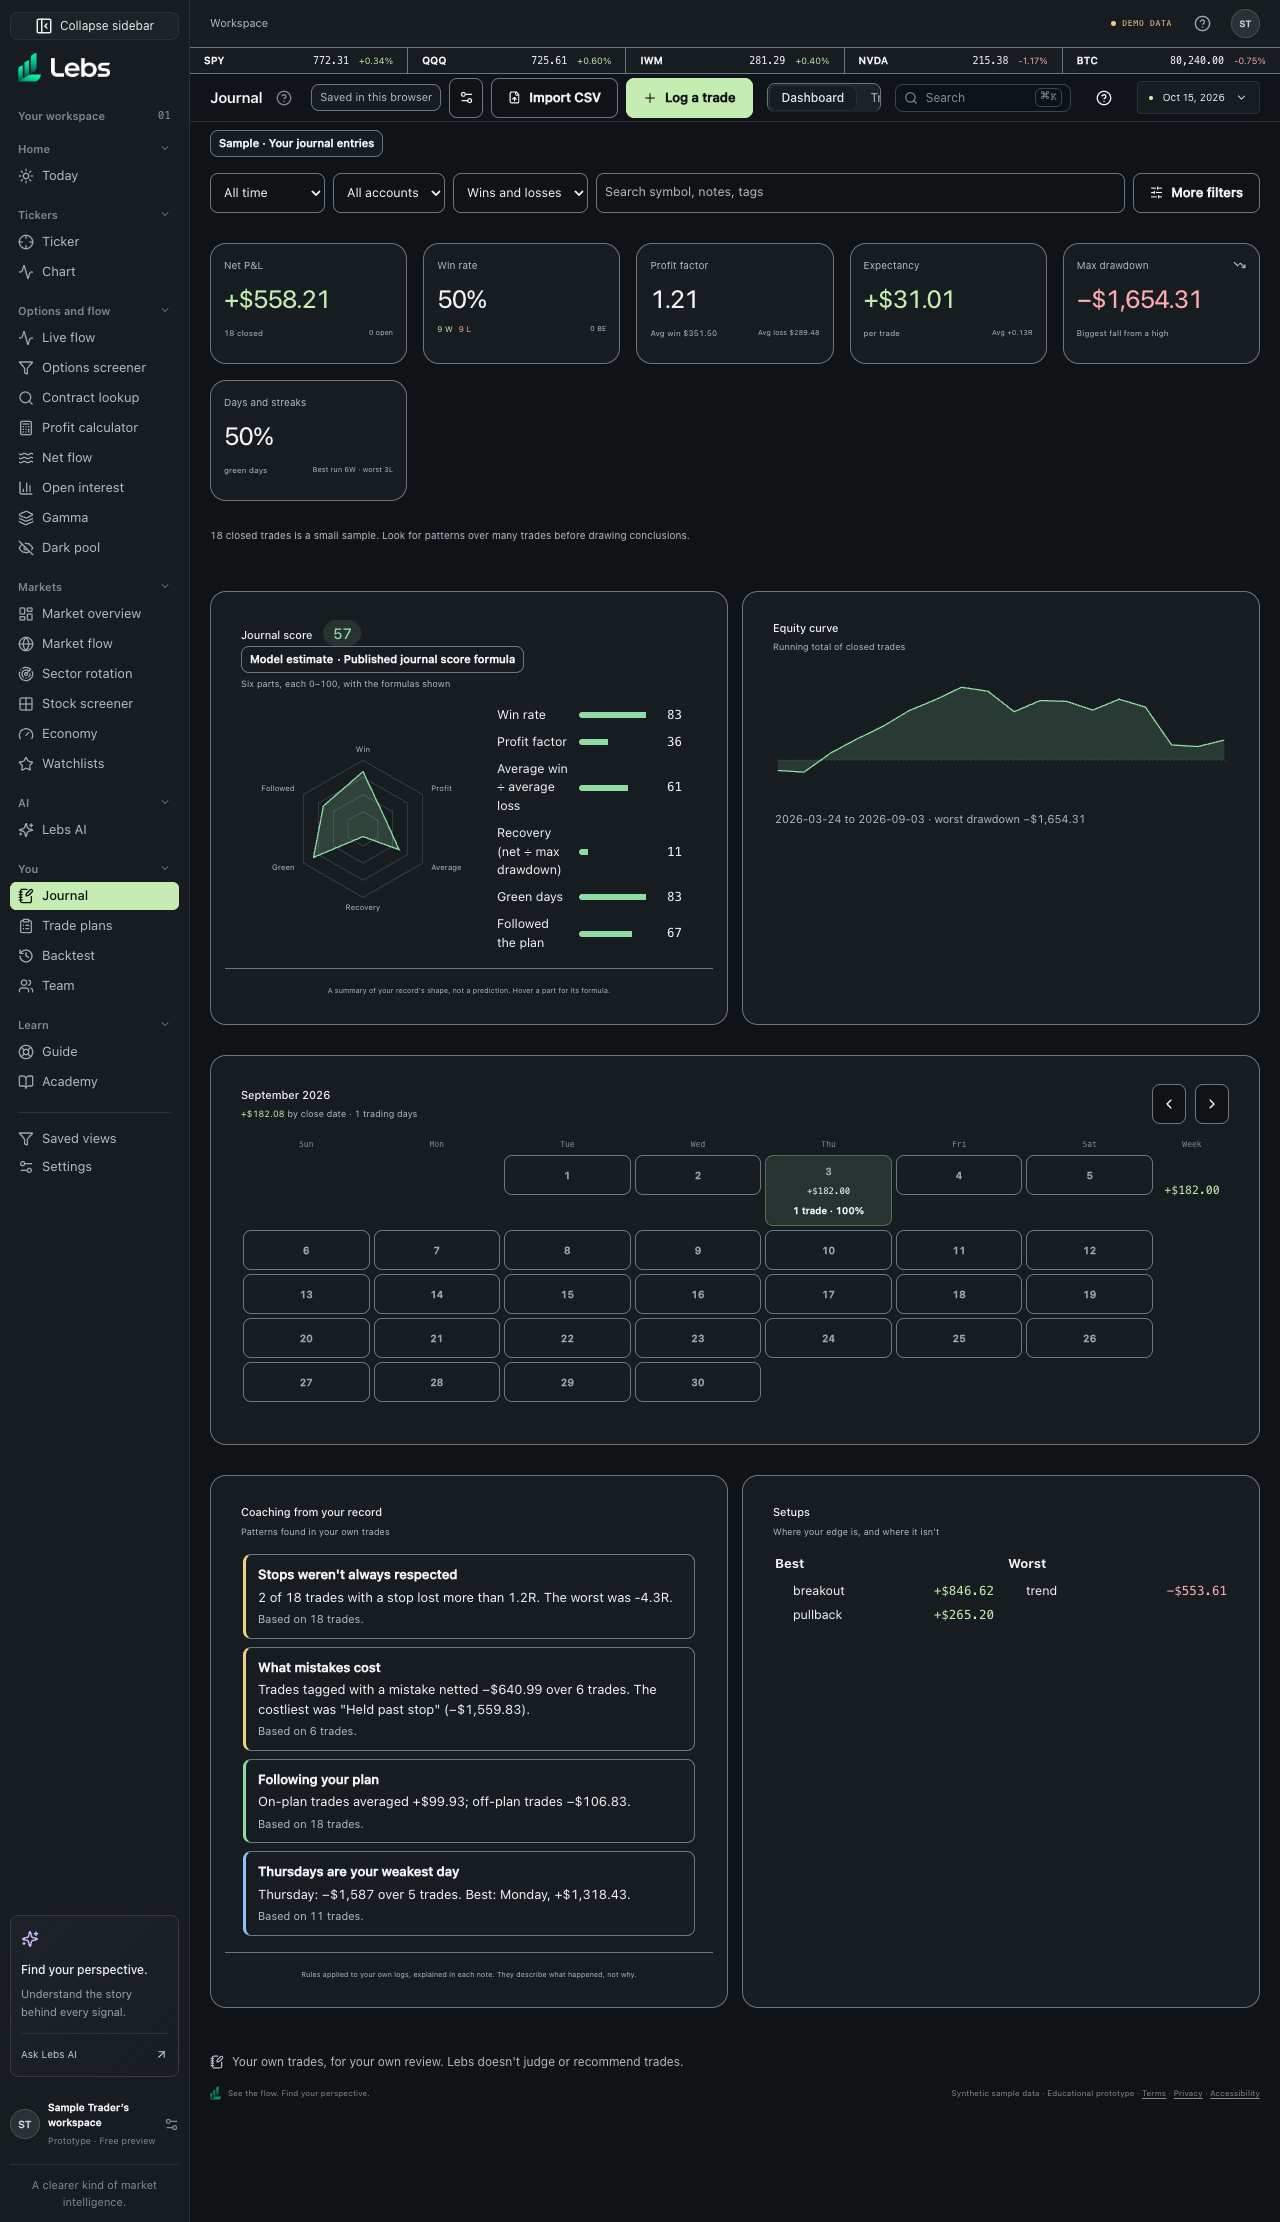
- Dashboard: net P&L, win rate (with breakeven trades counted separately), profit factor, expectancy, average R, drawdown, green days and streaks, your journal score, the equity curve, a profit-and-loss calendar with weekly totals, coaching and your best and worst setups.
- Click any trade for its detail: a chart of the days around it with entry, exit, stop and targets, a day-by-day replay of the open P&L, the worst and best points it reached (MAE and MFE), screenshots, and buttons to write a review or share it with your team.
- Reports: pick any of 18 ways to group trades (setup, tag, mistake, emotion, playbook, day of week, hour, time held, result in R and more) and any measure. Cross analysis shows two at once, and Best and worst ranks your tags.
- Risk: the Portfolio & risk tools inside your journal. The first time you open it, your open share trades become the holdings (netted per symbol); later, click 'Use my open journal trades' to load them again. Change quantities, add cash or add holdings by hand, then read the value at risk, stress tests and drawdowns.
- Playbooks: write each strategy as rules with entry, exit and risk, or start from a template, then see how the trades linked to it performed and how often you followed its rules.
- Daily: tick your pre-session checklist, write the pre-market plan, read the end-of-day summary built from your trades, write the recap, and watch the consistency heatmap fill in.
- Notebook: every written entry in one place, with templates (pre-market, recap, trade review, weekly recap), folders, search and links to trades.
- Filters at the top (date, account, result, search, and 25 more under More filters) apply to the dashboard, the trade list and every report.
Every control, explained
- Add or edit a trade
- One record per trade with optional stop, targets, times, tags, mistakes, emotions, rating, playbook and account; options multiply by 100 shares per contract. How: Log a trade, then More details for the rest. Default fees fill in from Journal settings.
- CSV import
- Up to 1,000 trade rows or 5,000 broker executions at a time, paired into round trips. How: Choose the file, pick 'one row per trade' or 'one row per buy or sell', check the columns, import.
- Journal score
- Six parts scored 0–100 with fixed formulas: win rate, profit factor, average win ÷ average loss, recovery from drawdown, green days, and following your plan. Needs 10 closed trades. How: Hover a part for its formula.
- Calendar
- Daily net results colored by size, trades and win rate per day, and weekly totals. How: Click a day to see its trades.
- Coaching
- Patterns in your own record: bigger trades right after a loss (possible revenge trading), results after losing streaks, busy days, holding losers longer than winners, losses beyond the stop, what mistakes cost, and weak weekdays. How: Each note says how many trades it rests on.
- Trade detail
- Chart with levels, replay slider, MAE/MFE in dollars and R, share of the best move you kept, screenshots, review and team sharing. How: Click a trade in the Trades tab.
- Reports and cross analysis
- 18 groupings × 10 measures, a two-way grid, and best, worst, most used and highest-win-rate tags. How: Pick from the menus in the Reports tab.
- Risk tab
- Value at risk, stress tests, drawdowns, pre-trade checks and portfolio tools on the holdings you hold now. Open share trades fill the holdings; options and net short positions can't be expressed as holdings, so the note says which were left out. How: Risk tab; 'Use my open journal trades' reloads them, and every holding can be edited by hand. Saved in this browser only.
- Playbooks
- Your strategies as written rules, with their own results and rule-following rate. How: New playbook, or Start from a template and edit. Pick one in a trade's Playbook field (under More details) to link the trade to it.
- Daily routine
- Checklist, pre-market plan, end-of-day summary and recap, and a 26-week consistency heatmap. How: Daily tab; change checklist items in Journal settings.
- Economic calendar
- The day's scheduled US data releases (CPI, jobs, GDP, PCE, retail sales and more) and the next two weeks, high-impact ones marked, from the St. Louis Fed's FRED release calendar. How: Daily tab; pick a date to see its releases.
- Journal settings
- Breakeven range, default commission per stock trade and per option contract, your accounts and your checklist. How: The gear button next to Import CSV.
- Expired options
- Open options past their expiry are listed so you can close them at $0 in one click. How: Use the banner when it appears.
Reading the numbers
- R (R-multiple)
- The result divided by what you planned to risk (entry to stop). +2R made twice the planned risk; −1R lost exactly the planned amount.
- Expectancy
- Average result per closed trade. Positive means the trades, taken together, made money.
- MAE and MFE
- Maximum adverse and favorable excursion: how far price went against you and in your favor while you held the trade.
- Profit factor
- Money made on winners ÷ money lost on losers. Above 1 means net profit.
- Breakeven
- A trade closed within the range you set in settings. It isn't counted as a win or a loss.
Tips
- Add a stop to every trade: R makes trades of different sizes comparable.
- Tag mistakes honestly. The 'What mistakes cost' note is usually the most useful thing in the journal.
- Write the recap on the same day, before you look at the next session.
Common mistakes
- Logging only the winners.
- Using a different tag every time, which makes reports meaningless.
- Reading a pattern into a handful of trades.
Limits to know
- Trades, notes, playbooks and settings are stored with your account (in this browser for the test login and the demo). Screenshots need a signed-in account.
- Lebs doesn't connect to brokers yet: trades are entered or imported from a CSV. Automatic broker sync needs a paid partner.
- MAE, MFE, the trade chart and replay use daily bars, so they can't see moves within a day. Option prices aren't charted.
- Coaching describes your own record with simple rules; it isn't advice and can't know why a trade was taken.
- The economic calendar lists scheduled US releases from FRED (dates, not times; most come out at 8:30 AM ET). Fed meeting dates link to the Federal Reserve's own calendar.
Try it: Log one past trade with a stop and a target, tag one mistake, then open it from the Trades tab and drag the replay slider.
Lebs is for education and research, not investment advice, and it places no orders.