

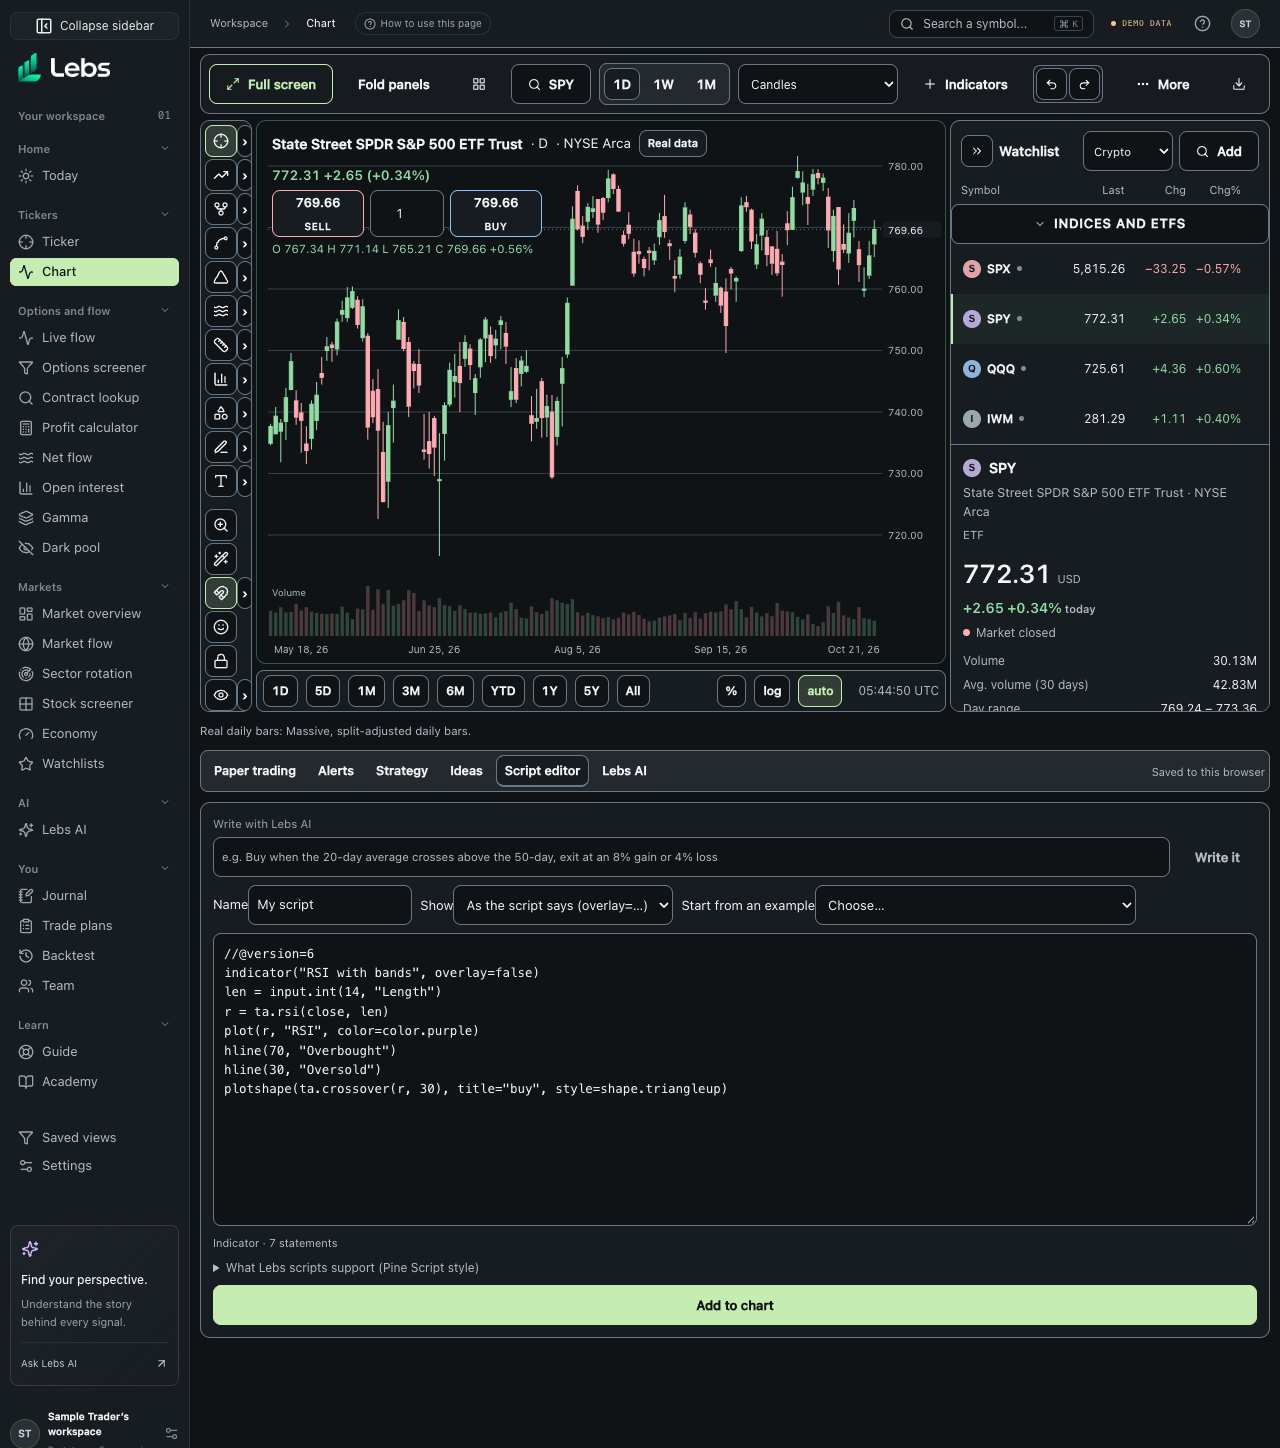
Step by step
- Open the Script editor panel and click 'New script'. Start from one of four examples: RSI with bands, a moving-average cross strategy with a bracket (stop and target), an RSI mean-reversion strategy, or a custom function with a loop and an array. Or describe what you want and click 'Write it' to have Lebs AI draft it (needs a signed-in account and the AI service).
- Write a script. Lebs scripts read like Pine Script: variables, if and for, functions, ta.* indicator functions (ta.sma, ta.rsi, ta.crossover and more), plot(), and strategy.entry / strategy.close for strategies. The panel lists what's supported.
- Choose where it draws: on the price chart, in its own panel, or as the script says.
- For a strategy, open the Strategy panel to see net profit, closed trades and win rate, profit factor, max drawdown, Sharpe and Sortino, the list of trades and the equity curve against buy and hold.
- Ideas: write what you see on the chart and what would prove you wrong, and save it with the chart. Your ideas are listed for later.
- Lebs AI on the chart: ask a question about the chart in plain English. It needs the AI service to be switched on; until then it explains that it's unavailable.
- Journal on the chart: log a share trade for the symbol you're looking at (the entry price starts at the chart's last price and the date at today), leave the exit blank while it's open, and see that symbol's record from your journal: closed and open trades, win rate, net P&L and the newest trades. Options, tags and screenshots are on the full Journal page.
Every control, explained
- Script editor
- A Pine Script-style language that runs bar by bar in your browser. How: Write, run, place on the chart.
- Strategy tester
- Results of a strategy script with an equity curve and trade list. How: Strategy panel.
- Ideas
- Saved notes tied to a symbol and chart. How: Ideas panel.
- Lebs AI (chart)
- Plain-English questions about the chart. How: AI panel; needs the AI service.
- Journal (chart)
- Log a trade for the chart's symbol and see that symbol's journal record. How: Journal panel, next to Lebs AI. Trades go to the same journal as the Journal page (your account when signed in, this browser with the test login).
Reading the numbers
- Sharpe and Sortino
- Return per unit of risk. Sortino only counts downside swings as risk.
- Max drawdown
- The biggest fall in the strategy's equity from a peak.
Common mistakes
- Tweaking a strategy until it fits the past perfectly (overfitting).
- Ignoring costs: the tester uses closing prices without commissions unless you add them.
Limits to know
- Scripts run in your browser with no internet or page access.
- The chart AI needs an Anthropic key on the server, which waits for funding.
Try it: Create a script from the 'Strategy: moving-average cross with a bracket' example on SPY and compare its equity curve with buy and hold in the Strategy panel.
Lebs is for education and research, not investment advice, and it places no orders.