

Step by step
- Open Ticker from the sidebar, or press ⌘K (Ctrl+K on Windows) and pick any stock, ETF or coin; the Ticker page opens on Overview. On the Chart screen, ⌘K changes the chart's symbol instead. The address shows the symbol and tab, like #ticker/nvda/greeks, so you can bookmark or share any tab.
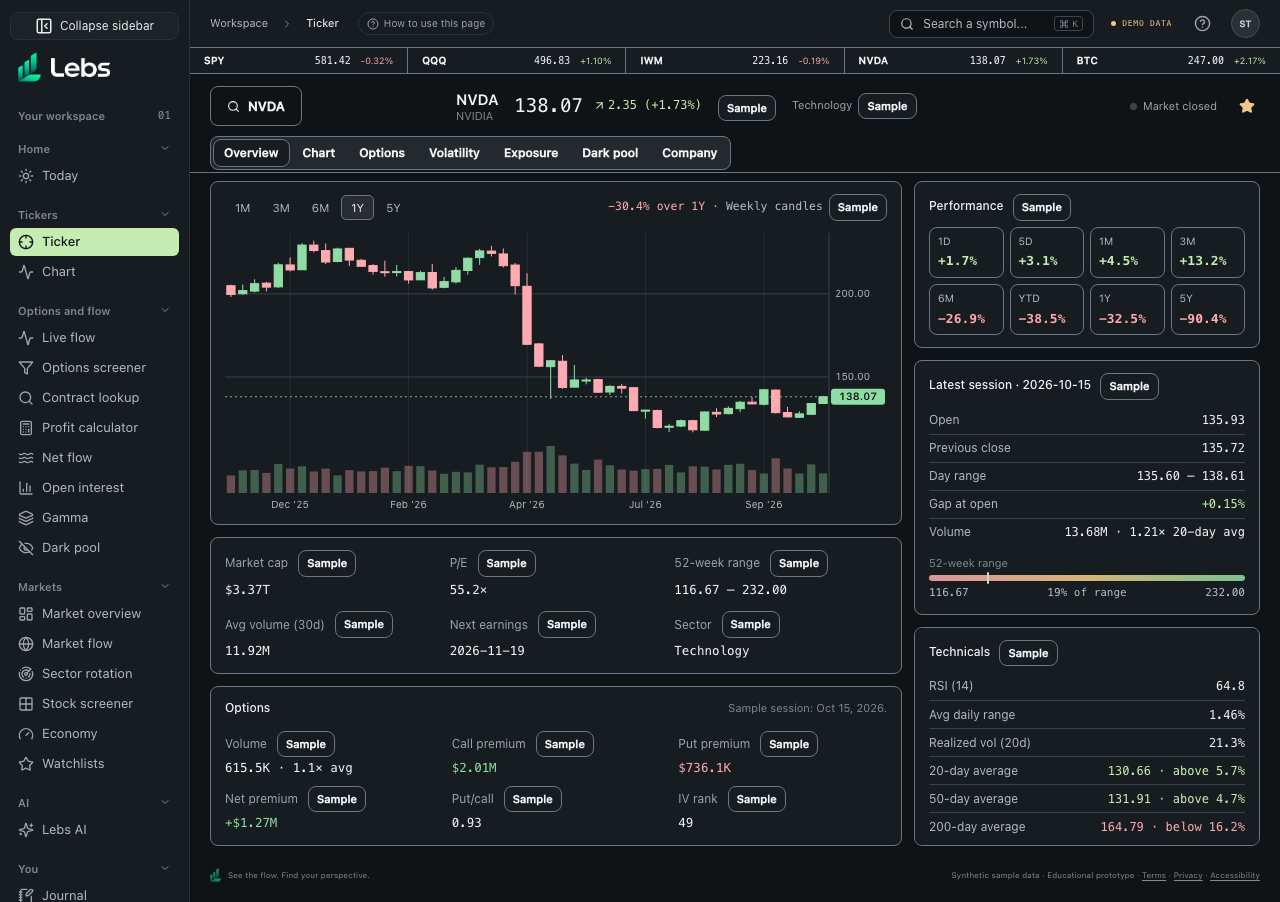
- Read the header first: the ticker, its name, the last price and change, the sector, and whether the market is open. A Sample badge means the numbers are sample data, not real quotes.
- Pick a group under the header: Overview, Chart, Options, Volatility, Exposure, Dark pool or Company. Its tabs appear in a second row. Use the arrow keys in either row, scroll a row that does not fit, or choose a hidden item from More. Opening a group shows its first tab.
- Change the ticker with the search at the top left: type a ticker or a name and pick a result. You stay on the same tab, and screens that follow the shared symbol, such as Live flow, follow too. Tabs that need option data say so in one line for a ticker the data source has no options for; the price, volatility history and company tabs work for any ticker with daily prices.
- Look at the badge on every figure before you read it: Sample (made-up numbers from the sample session), Delayed or Live (real data), Modeled (calculated by Lebs under stated assumptions) or Needs live data (switched off until a licensed feed is connected). Hover a badge for its meaning.
- On Overview, hover the candlestick chart for a session's open, high, low and close, and switch the range. Then read the key stats, the options row, and Performance, Latest session and Technicals on the right. Hover any number for what it is and where it comes from.
- In the Options group, pick an expiry with the Expiry menu on a tab, then compare tabs for the same expiry: Options Volume and Open Interest show contracts by strike, Greeks shows the sensitivities, Net Options Flow shows who paid the ask or hit the bid through one session.
- Every tab is built to fit a 1280 by 800 window without scrolling the page: panels share the height, charts fill their panel, and a long table scrolls inside its own panel. Options Chain and Dark Pool Flow hold more than one screen, so they scroll inside the tab.
Every control, explained
- Ticker search
- A search box for any US stock, ETF or coin. Type a ticker such as AAPL or BRK.B, or a name such as Bitcoin. How: Click it, type, and press Enter or click a result. The tab you are on stays open.
- Price and change
- The last price and today's change, with the source on hover. How: A Sample badge means sample prices. Real stock prices need a data provider; coins use live CoinGecko prices.
- Sector and market dot
- The sector (from SEC filings, or a Sample badge for the sample symbols) and a dot that is green while U.S. stocks are trading, 9:30 AM to 4:00 PM ET on weekdays. Coins show 24/7. How: Hover the dot for the hours. Holidays are not counted.
- Watchlist star
- Adds the symbol to your watchlist, or removes it. How: Click it. It works for the sample symbols only, because the watchlist holds those today.
- Groups
- Seven groups for one ticker: Overview, Chart, Options, Volatility, Exposure, Dark pool and Company. How: Click a group, or focus the control and use the arrow keys. The address updates as you switch, so back and forward work.
- Tabs
- The tabs inside a group: Chart has 2, Options 7, Volatility 4, Exposure 2 and Company 5. Overview and Dark pool have one each, so no row shows. How: Click a tab, or use the arrow keys, Home and End when the row has focus. Each tab loads when you open it.
- Data badges
- A label on every sample or modeled figure: Sample, Delayed, Live, Modeled or Needs live data, with its own icon and a longer meaning on hover. How: Hover or focus a badge. Badges with a date, such as chain as of 2026-10-15, name the snapshot the numbers come from.
- Price chart
- Candlesticks drawn like the Trading chart (Overview): a right-hand price scale, the last price tagged on it, and volume underneath. Long ranges switch to weekly or monthly candles so each stays readable. How: Click 1M, 3M, 6M, 1Y or 5Y. Hover for a session's open, high, low and close and the change since the start of the range; the label beside the change says whether candles are daily, weekly or monthly.
- Key stats
- Market cap, P/E, 52-week range, average volume over 30 days, next earnings (estimated from SEC filings) and sector. How: Read only. Sample numbers carry a Sample badge; real ones show their source when you hover.
- Options row
- Options volume against its 30-day average, call premium, put premium, net premium, put/call ratio and IV rank, from the sample session. How: Read only. All six are sample data, and the 30-day average is modeled from the stock's own volume.
- Performance
- Price change over 1D, 5D, 1M, 3M, 6M, YTD, 1Y and 5Y, from the ticker's daily closes. YTD measures from the last close of the previous year. How: Read only. A period longer than the loaded history shows —.
- Latest session
- The last session's open, previous close, day range, gap at the open and volume against its 20-day average, plus where the price sits in its 52-week range. How: Read only. The 52-week bar appears once a full year of sessions is loaded.
- Technicals
- RSI (14), average daily range, 20-day realized volatility, and the 20-, 50- and 200-day averages with how far the price is above or below each. How: Hover a row for its formula. They are readings of past prices, not signals to buy or sell.
- Stock Chart
- The same full trading chart as the Chart screen, following the active ticker and sharing saved drawings and layout (Chart group). How: Use Full screen, drawing tools, indicators, range buttons and Fold panels here, just as on the Chart screen.
- Options Charts
- The price history of one option contract for the active ticker (Chart group). How: Type a contract such as SPY 11/20 580C, or pick its expiry, strike and type, then read its candles and volume, with implied volatility and open interest if you turn them on. The prices are sample data.
- Options Chain
- The option chain with Greeks, a contract price chart and a profit calculator, with the math shown (Options group). How: Pick an expiry and a strikes range, click a bid to sell or an ask to buy, then read the payoff and probabilities. The tab scrolls inside itself.
- Options Flow
- The Live flow table, showing only this ticker's trades. How: Use the call, put and 0DTE chips and Filters. Click a trade for its story.
- Net Options Flow
- Net call and put premium through one session, premium by expiry, and the contracts that drove it. Net call premium is calls bought at the ask minus calls sold at the bid; puts work the same way. How: Pick the Session, read the four figures at the top (net call premium, net put premium, calls minus puts, call/put premium), then the chart and the Top contracts table. The side of a trade is inferred, so it is evidence of direction, not proof of intent.
- Options Volume
- Contracts traded by strike for one expiry, calls on the left and puts on the right, with the put/call volume ratio and a chart by expiration. How: Pick the Expiry. The at-the-money row is highlighted. Hover a bar for its count; the table beside it holds the same numbers.
- Open Interest
- Contracts still open by strike for one expiry, and by expiration, with the date of the snapshot. How: Pick the Expiry. Open interest is counted once a day, so it shows the last snapshot, not today's trading.
- Open Interest Changes
- The contracts whose open interest rose or fell the most against the session before, for this ticker. How: Read the feed from the biggest change down. A rise means more contracts are open; it does not say whether buyers or sellers opened them.
- Greeks
- Delta, gamma, theta, vega and implied volatility strike by strike for one expiry, calls and puts, modeled with Black-Scholes from the sample chain. How: Pick the Expiry and the Greek to chart. Hover or focus a Greek's question mark for what it means. Delta and gamma are per $1 move in the stock; theta is dollars per day and vega dollars per volatility point, both per share (multiply by 100 for a contract).
- Implied Volatility
- At-the-money implied volatility for each expiry, and IV rank: where it sits within its year (Volatility group). How: Read the chart and the figures. IV rank is a modeled number, measured here against realized volatility. Scroll within the tab for the term and skew charts, expiry selector, and expected-move table.
- Historical Volatility
- How much the price actually moved over 10 to 90 trading days, from the ticker's own daily closes, with a rolling line and a cone of its lowest, middle and highest readings. How: Read the windows, then the Now column against the cone. It works for any stock, ETF or coin with daily prices, not only the sample tickers.
- Volatility Skew
- Implied volatility by strike for one expiry, calls and puts. How: Pick the Expiry. A higher line on low strikes means puts cost more than calls at the same distance from the price.
- Volatility Term Structure
- At-the-money implied volatility across expiries, with the expected move to each. How: Read the line from near to far expiry. The expected move is price × implied volatility × √(years to expiry), shown in dollars and percent.
- GEX
- The shared Gamma terminal for the active ticker, with expiry and view controls and explicit sample-data labels (Exposure group). How: Open GEX. Supported sample symbols show levels and exposure; symbols without an options chain explain the missing data.
- Market Maker Exposure
- Dealer delta (DEX), vanna (VEX) and charm (CHEX) exposure by strike, modeled from the sample chain. How: Pick one expiry or All expiries. Green bars are positive, red bars negative. It assumes dealers are long the calls and short the puts that customers trade; that is an assumption, not a fact about any dealer's book.
- Dark Pool Flow
- The Dark pool screen for the active ticker: off-exchange prints and their size. How: Use its own filters. The tab scrolls inside itself because it holds more than one screen.
- Financials
- Revenue, margins, cash flow, cash and debt by fiscal year, and recent insider trades, from SEC filings (Company group). How: Read only. Shown for stocks; funds and coins have no company filings.
- Earnings
- The next earnings date estimated from the company's past 8-K Item 2.02 filings, with its window and status (Estimate, Due now, Later than usual); past releases with their filing time and the stock's move in the first session after; quarterly revenue, net income, EPS and dividends with year-over-year changes; yearly EPS and net income; and the recent filings (Company group). How: Read only. Hover the date for how it was estimated. Fourth quarters marked * are the 10-K year minus three 10-Q quarters. Moves need real daily prices.
- News tab
- Headlines once a licensed source is connected, and below them the company's recent 8-K filings from SEC EDGAR, newest first, each item number in plain words. How: Click a filing to open it on SEC EDGAR. A filing date is the day it was filed, not an earnings date.
- Seasonality
- Average or median return by calendar month and the monthly return grid, for YTD, 1Y, 3Y, 5Y, 10Y or All. How: Choose a range. The Seasonality guide article explains it in full.
- Institutions
- Large holders: anyone over 5% from their latest Schedule 13D (activist) or 13G (passive) filing, with stake, shares and date. Well-known fund managers: positions in 21 managers' latest 13F reports (Berkshire Hathaway, Pershing Square, Bridgewater, Renaissance and others), with value, share of their portfolio and the change from the quarter before (Company group). How: Read only. Click a holder's filing or a manager's name to open the SEC filing. 13F reports are as of quarter end and filed up to 45 days later.
Reading the numbers
- Sample, Delayed, Live, Modeled, Needs live data
- The five badges. Sample numbers are made up for the sample session of October 15, 2026. Delayed and Live are real data. Modeled numbers are calculated by Lebs from other data under stated assumptions. Needs live data means a licensed feed is missing, so the field is off.
- IV rank
- Where the 30-day implied volatility sits between the lowest and highest in the past year: 0 is the lowest, 100 the highest. Here it is measured against realized volatility, because past implied volatility needs a licensed options history.
- Put/call ratio
- Put volume divided by call volume. Above 1 means more put trading than call trading; it is a hint about mood, not a forecast.
- Net premium
- Premium paid at the ask minus premium received at the bid. The trade's side is inferred from where it printed, so it is evidence for a direction, not proof of opening activity or intent.
- Open interest
- Contracts that exist and are not yet closed, counted once a day. Volume counts trades; open interest counts what is still open.
- Expected move
- Price × implied volatility × √(years to expiry): the size of move the option prices imply, one standard deviation either way. It is an estimate from prices, not a forecast.
- DEX, VEX, CHEX
- Dealer delta, vanna and charm exposure: how dealers' hedges would change if the price, volatility or time moved, under the assumption that they are long calls and short puts against customers.
Tips
- Use Ticker as the first stop for a new name. Open the full chart once you know why you care.
- Compare the options row with Key stats: heavy call premium on a stock near its 52-week high reads differently from the same premium near its low.
- Stay on one expiry while you move between Options Volume, Open Interest and Greeks, so you compare the same contracts.
Common mistakes
- Reading sample prices as today's market. The Sample badge in the header and on each number says which you are looking at.
- Treating a modeled number, such as IV rank or dealer exposure, as an observed one. The Modeled badge says it is calculated under assumptions.
Limits to know
- Use Settings → Display → Reduce transparency for opaque surfaces.
- Options volume, premium, IV rank, flow, open interest, Greeks, the top-five lists and the option chain are sample data for ten symbols. Every other symbol shows daily prices, historical volatility and company facts only.
- Stock prices are real daily bars only when a data provider is connected; otherwise the page says Sample. Coins use live CoinGecko prices.
- Company facts come from 10-K and 10-Q filings, so they lag the latest quarter. The next earnings date is an estimate from past filings, not a company announcement; analyst estimates, surprises and news need licensed feeds.
- Greeks, IV rank, dealer exposure and expected move are modeled, and dealer exposure rests on an assumption about who holds what. Nothing here is a prediction or advice.
- GEX and Market Maker Exposure use labeled sample options chains for supported symbols; other symbols need a licensed chain.
- Large holders come only from Schedule 13D/13G filings in EDGAR's XML format (since December 2024). Fund positions cover 21 well-known managers, not every 13F filer, and match by CUSIP, so other share classes aren't counted.
Try it: Open Ticker for NVDA, switch to the Options group, open Greeks and pick the second expiry, then switch to Open Interest and check that it kept the ticker. Last, open Volatility › Historical Volatility and compare the Now column with the cone.
Lebs is for education and research, not investment advice, and it places no orders.