

Step by step
- Open Dark pool. It shows the workspace's active symbol (coins and indexes fall back to SPY, since FINRA covers stocks and ETFs). Pick another symbol in the page header; it becomes the active symbol everywhere.
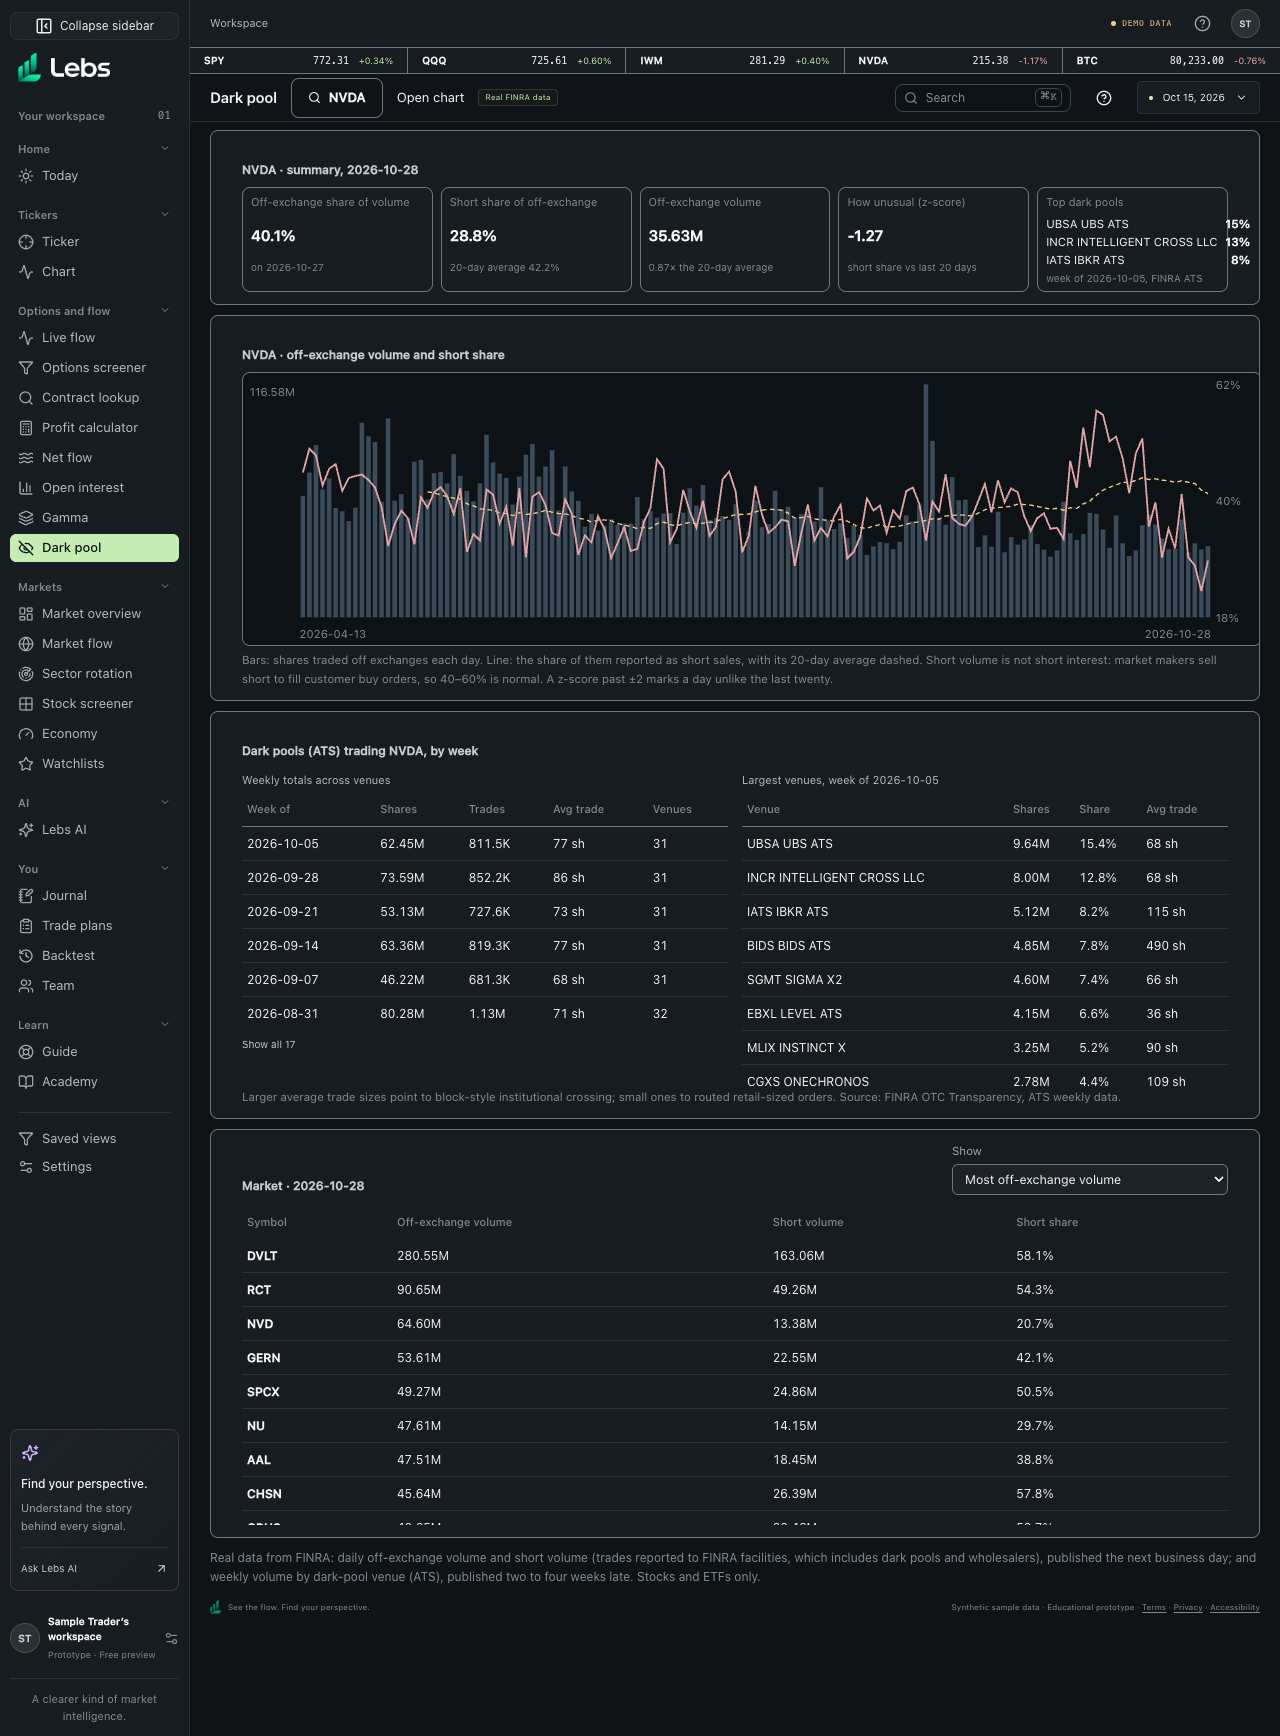
- Read the summary row: off-exchange share of all volume, the short share of off-exchange volume against its 20-day average, off-exchange volume against its 20-day average, how unusual the short share is (z-score), and the three largest dark pools in the latest ATS week.
- Read the chart: bars are daily off-exchange volume; the line is the short share, with its 20-day average dashed.
- Below, 'Dark pools (ATS) trading this symbol, by week' has weekly totals and the largest venues. Each table scrolls inside its panel; 'Show all' lists every row.
- At the bottom, the market table lists the symbols with the most off-exchange volume or the highest short share; click one to load it.
Every control, explained
- Summary row
- Off-exchange share, short share, off-exchange volume, z-score and the top three dark pools, for the latest day. How: Read across. Off-exchange share needs the price provider's real daily volume for the same date; without it the tile says so.
- Loading problems
- When FINRA data doesn't load, the screen says why: this build has no Supabase URL or key, the Supabase project is missing the market function or FINRA tables, the project refused or failed the request, FINRA itself didn't answer, or the project couldn't be reached. A refresh that fails keeps the last data on screen. How: Try again reloads. If the build has no Supabase URL, use the team's .env.local and rebuild.
- Daily off-exchange and short volume
- From FINRA's daily files, published the next business day. How: Read the chart.
- Weekly ATS volume
- Volume by dark-pool venue, published 2–4 weeks late. How: Two tables: weekly totals and the largest venues. 'Show all' expands a table.
- Market leaders
- Most off-exchange volume, or highest short share among the top 200. How: Choose in 'Show'; click a row or press Enter on it. 'Show all' lists up to 50. Long tables scroll inside their panels.
Reading the numbers
- Off-exchange share
- Shares reported to FINRA's off-exchange facilities divided by all shares traded that day. It includes wholesalers filling retail orders, not only dark pools.
- Short volume
- Shares sold short that day. Not the same as short interest: market makers sell short routinely to fill buy orders, so 40–60% is normal.
- z-score
- How unusual today's short share is compared with the last 20 days. Beyond ±2 is unusual.
- Average trade size
- Large averages suggest block trades between institutions; small ones, routed retail orders.
Common mistakes
- Reading high short volume as a bet against the stock.
- Treating off-exchange share as dark-pool share: wholesalers are most of it.
Limits to know
- Real but delayed: daily data is next-day, venue data 2–4 weeks late. Stocks and ETFs only.
- Off-exchange share uses the price provider's daily volume; it shows '–' when that isn't connected.
Try it: Load TSLA, read its off-exchange share and top dark pool, then find the day in the chart with the highest off-exchange volume.
Lebs is for education and research, not investment advice, and it places no orders.