

Step by step
- Open Market flow from the Markets group in the sidebar, right after Market overview.
- Tide opens first. Read Market Tide: running net call premium and net put premium across every sample ticker through the session. Pick another session from the Session menu to see an earlier day. Below it, choose a group for Net Tide to see net calls minus net puts as one line.
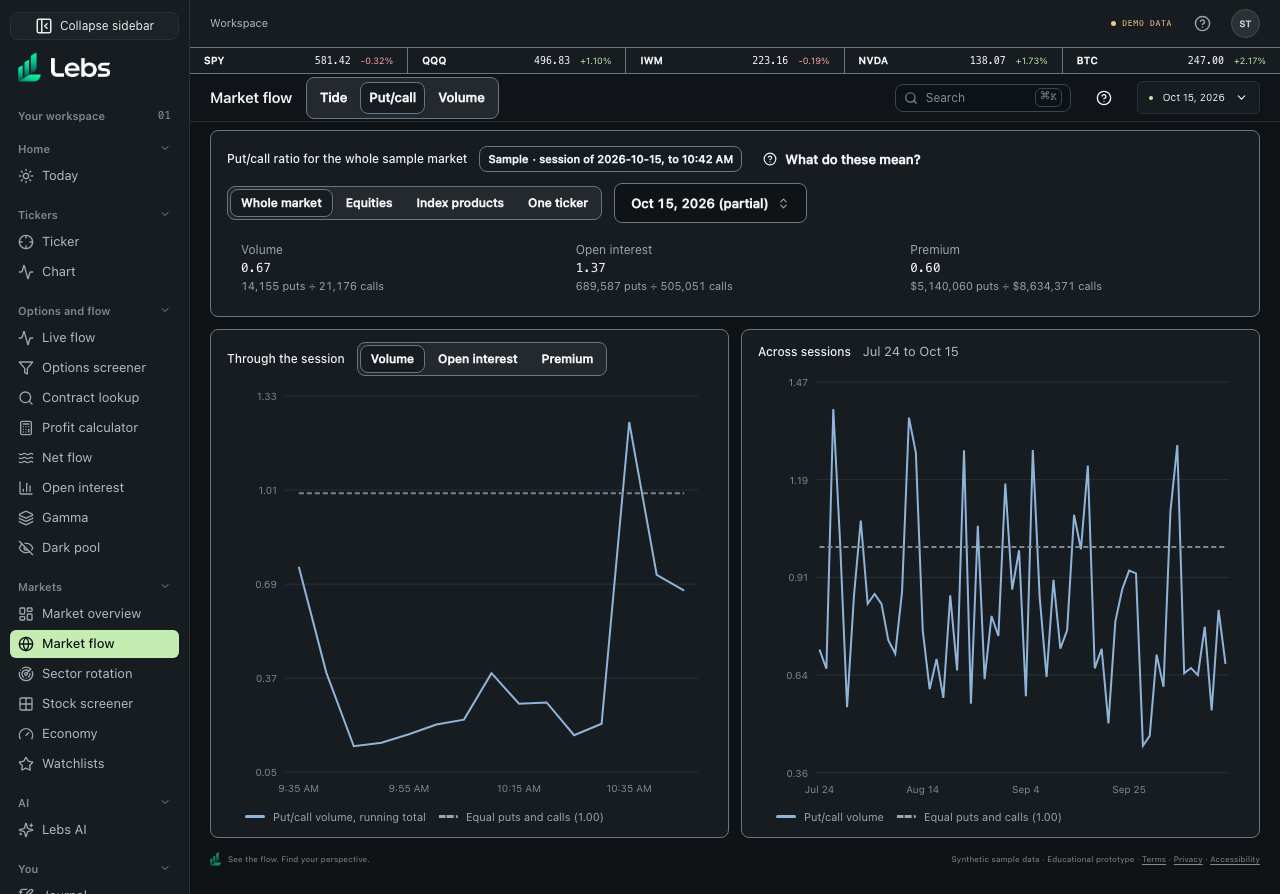
- Click Put/call in the page header. Choose a scope (Whole market, Equities, Index products or One ticker) and a session, then read the three ratios at the top: volume, open interest and premium. Open What do these mean? for one sentence on each.
- Choose which ratio to chart with the Volume, Open interest and Premium buttons. Through the session shows the running ratio from the open; Across sessions shows one value per session, with a dashed line where puts equal calls (1.00). The sessions load one at a time, so a status line counts them.
- Click Volume in the page header. With Whole market, read contracts traded by expiration (0DTE, 1–7, 8–30, 31–90 and 90+ days) and by distance from each stock's own price, in 2.5% bands from −20% to +20%, calls and puts side by side.
- Choose One ticker on Volume to see that stock's actual strikes for one expiry instead, calls on the left and puts on the right. Pick the Expiry from the menu.
Every control, explained
- Tide
- Market Tide and Net Tide for the sample sessions, with a closing value for each past session. How: It opens first. Pick a session and a group.
- Put/call
- Puts divided by calls for the whole sample market, equities only, index products only (SPY, QQQ, IWM, SPX) or one ticker, as volume, open interest and premium ratios. How: Click Put/call in the page header.
- Scope
- Which tickers the ratios and charts cover: the whole sample market, equities only, index products only, or one ticker you choose. How: Click a scope; with One ticker, pick the ticker from the menu beside it.
- Session
- The sample session the ratios cover. The latest sample session stops at 10:42 AM ET and says so. How: Pick a session from the menu.
- Put/call ratios
- Volume (contracts traded), open interest (contracts still open, each counted once) and premium (dollars paid), each as puts divided by calls, with the two counts under it. How: Read only. A dash means there were no calls in that scope.
- Ratio to chart
- Which of the three ratios the two lines show. How: Click Volume, Open interest or Premium. Open interest has no line through the session because it is counted once a day.
- What do these mean?
- One sentence on each ratio, and a reminder that a high ratio is not automatically bearish, because puts are often bought as hedges. How: Click the button; Escape closes it.
- Through the session
- The chosen ratio as a running total from the open, in 5-minute steps, with a dashed line at 1.00. How: Read the line; the last point is the session's ratio.
- Across sessions
- The chosen ratio for every sample session, oldest to newest, with a dashed line at 1.00. How: Read the line; it fills in as the sessions load.
- Volume
- Options contracts traded across the sample market in the chosen session, by expiration and by distance from the stock price, or by strike for one ticker. How: Click Volume in the page header, then choose Whole market or One ticker.
- By expiration
- Contracts traded by days to expiry: 0DTE (expires that day), 1–7, 8–30, 31–90 and 90+ calendar days, calls and puts side by side. How: Read the bars; the figures above them give the totals.
- By distance from the stock price
- Contracts traded by how far the strike is from that stock's own price (strike ÷ price − 1), in 2.5% bands from −20% to +20%. How: Read the bars. Strikes of different stocks are never added together; contracts beyond ±20% are counted in a note under the chart.
- By strike
- With One ticker: that stock's contracts traded at each strike for one expiry, calls to the left and puts to the right. How: Pick the Expiry from the menu.
Reading the numbers
- Put/call ratio
- Puts divided by calls. Above 1.00 means more put activity than call activity. It describes what traded; it is not a forecast, and puts are often hedges.
- Volume, open interest and premium ratios
- Volume counts contracts traded. Open interest counts contracts still open (each once, for the contracts that traded that session). Premium counts dollars paid. They can point different ways.
- 0DTE
- Options that expire the same day as the session.
- Distance from the stock price
- The strike divided by the stock's price, minus 1. +5% means a strike 5% above the stock's price. It is the same measure for every stock.
- Sample
- The number comes from the sample session of October 15, 2026 and the sample sessions before it, not from a live market.
- Needs live data
- A field the sample data cannot honestly produce. It shows disabled until a licensed options feed is connected.
Common mistakes
- Reading a market-wide figure as a forecast. These describe what already traded; they are not predictions or advice.
- Calling a high put/call ratio bearish on its own. Puts are often bought to hedge stock that is held.
Limits to know
- Use Settings → Display → Reduce transparency for opaque surfaces.
- Put/call and Volume use the sample trade prints (about 300 a session across ten tickers), not every contract. Premium ratios can move on a few big trades.
- Open interest is counted for the contracts that traded in the session, not for every contract that exists, and only once a day, so it has no intraday line.
- The latest sample session is partial: it stops at 10:42 AM ET, so its ratios are not comparable with a full session's.
- Live market-wide options data needs a paid license, so every section starts on sample data.
Try it: Open Put/call, switch the scope from Whole market to Index products and compare the premium ratio. Then open Volume, choose One ticker, and find the expiry where SPY traded most.
Lebs is for education and research, not investment advice, and it places no orders.