

Step by step
- Open Ticker, select a symbol and open Seasonality. The initial range is 5Y. The page uses the same daily history as the trading chart and labels real and sample prices.
- Choose YTD, 1Y, 3Y, 5Y or All. Ranges end on the last available price session, rather than assuming today's close is already available. YTD keeps the prior December close to calculate January correctly.
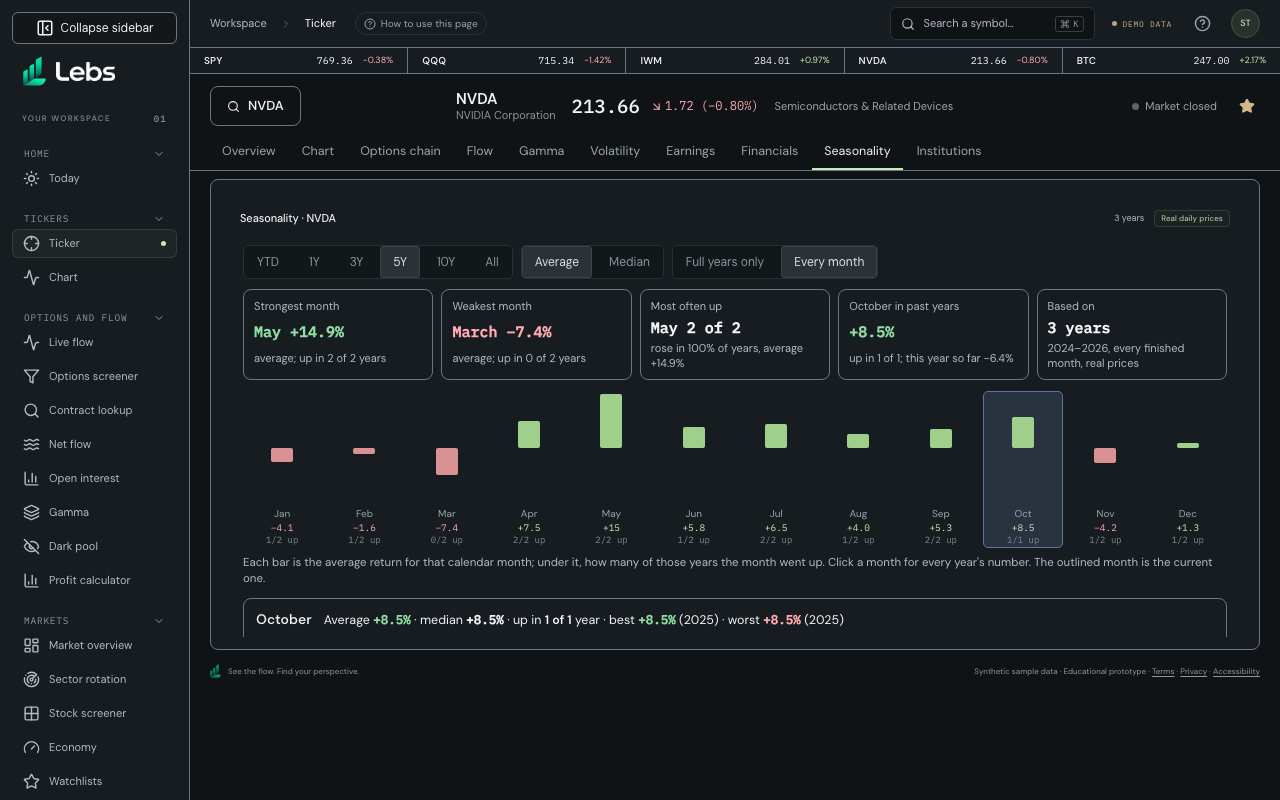
- Read the five headline numbers: the strongest and weakest month, the month most often up, how the current month has done in past years, and how many years the numbers rest on.
- Choose Average or Median (the middle year, which one huge year can't pull around), and Full years only or Every month. Every month uses each finished month in the range, so a month can rest on fewer years; each bar shows its count. With under two full years, Every month is picked for you.
- Read the bars: the axis and values show each calendar month’s average or median return in percent. Under each bar, the count says how many years rose; hover or focus a bar to identify the month and measure. Click a month for each year’s percentage return.
- Use Year by year for percentage returns in each month and year plus the number of years up. Month stats and Weekdays & quarters name each return and its unit. The unfinished latest month is shown but left out of the averages.
- Check the displayed start and end dates. A short-history message means the source does not cover the requested period; changing the range cannot create missing data.
Every control, explained
- History ranges
- YTD, 1Y, 3Y, 5Y, 10Y and All choose the visible analysis window. How: Select a range button. Five years is the default; YTD shows only the current data year.
- Average or median, full years or every month
- Average adds every year up; median is the middle year. Full years only uses calendar years with all twelve months; Every month uses each finished month in the range. How: Pick from the two switches next to the ranges. Each bar shows how many years it rests on.
- Headline numbers
- Strongest and weakest month, the month most often up, this month in past years (and so far this year), and how many years the numbers use. How: Read them first; the rest of the page has the detail behind each.
- Month detail
- One calendar month: average, median, how many years it rose, best and worst year, and each year's return. How: Click a month's bar or its name in Month stats. The current month is chosen at first.
- Monthly return grid
- Available month-end returns by year, including the latest partial year, with each year's total and the average and up count for each month. How: Read green and red cells. Empty cells have no available return and are not zero. A * marks a year that isn't finished.
- Weekdays and quarters
- The average and median daily move for each weekday and how often it rose; each quarter's return with its best and worst year. How: Open Weekdays & quarters under the bars.
Limits to know
- Use Settings → Display → Reduce transparency for opaque surfaces.
- History length depends on the source and symbol. Seasonality describes past closes and does not predict future returns. Missing years are never synthesized to fill a selected range.
Try it: Open NVDA Seasonality, compare 5Y with YTD, and check that the YTD grid contains only the latest data year.
Lebs is for education and research, not investment advice, and it places no orders.