

Step by step
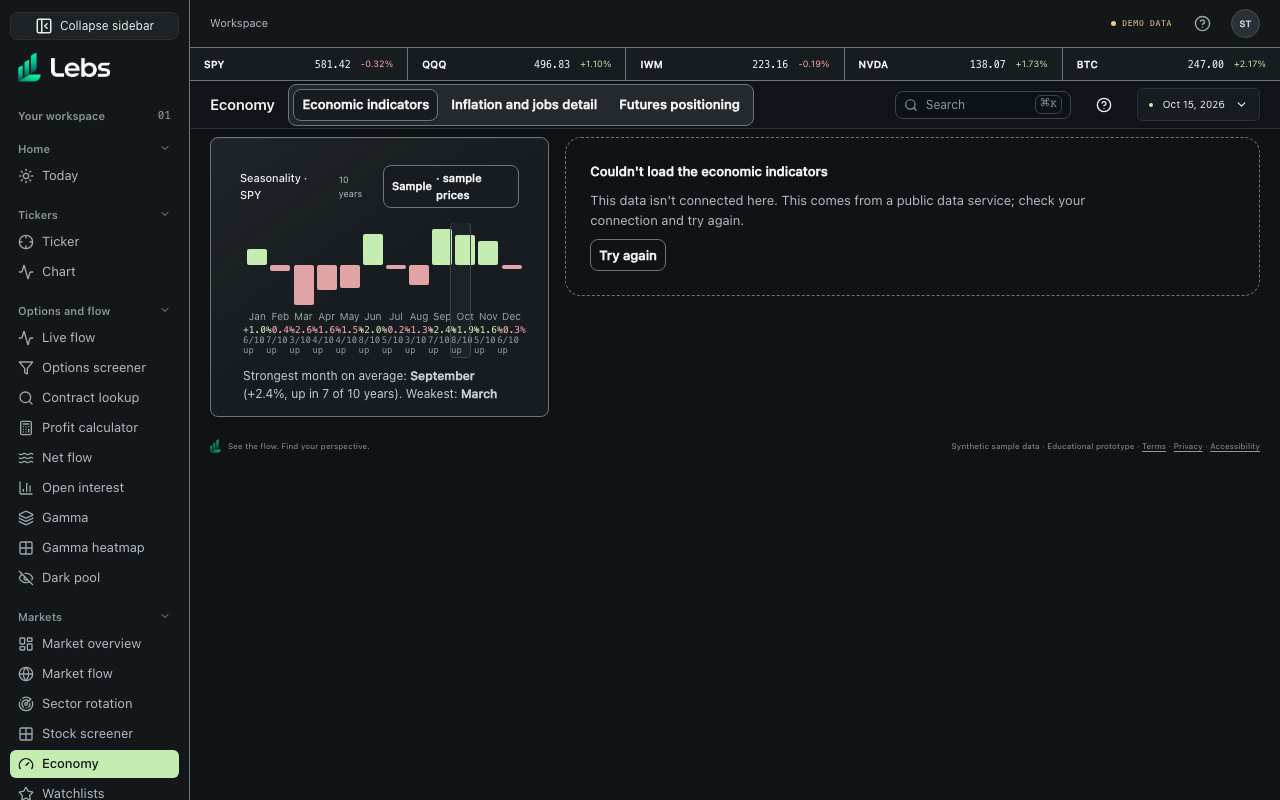
- Open Economy. The Economic indicators tab is six equal panels: Seasonality (returns shown as percentages) for SPY first, then the 18 numbers grouped into Rates, Inflation, Jobs, Growth, and Money and the Fed.
- Each row shows the latest value and the change since the previous reading, and on wide screens a 10-year line. Hover a row for its date, what the number means, which agency publishes it and the change since a year ago. A panel with more rows than fit scrolls inside itself.
- Under Rates, read whether the 10-year yields more or less than the 2-year (an inverted curve), and in Seasonality how SPY has behaved in each calendar month.
- Inflation and jobs detail: which prices are rising fastest (shelter, energy, food, cars, airfares and more), jobs added by industry over the last month and year, and whether pay is growing faster than prices.
- Switch to Futures positioning: for each market, speculators' net position (long minus short contracts), the change this week, the share of all open contracts, and where today sits in its 3-year range.
- Click a market to see three years of speculators' and hedgers' net positions on a chart.
Every control, explained
- Seasonality
- SPY's average return in each calendar month, how often that month rose, the strongest and weakest month, and the month so far this year. How: Hover a month for its numbers. It needs at least two full calendar years of prices; with fewer it shows the last twelve months' returns and says so. Sample prices are labeled.
- Economic indicators
- Fed funds, Treasury yields and the curve, breakeven inflation, CPI and core CPI, core PCE, unemployment, payrolls, jobless claims, real GDP growth, retail sales, industrial production, housing starts, M2 and the Fed's balance sheet. How: Hover a row for its description.
- Inflation and jobs detail
- CPI for 12 categories (change on the year and the month), payroll jobs for 11 industries, and average hourly pay against inflation, from the Bureau of Labor Statistics. How: Hover a category for what it covers.
- Futures positioning
- CFTC Commitments of Traders for stock indexes, Treasuries, currencies, oil, gas, metals, bitcoin, VIX and corn. How: Click a row for its 3-year chart.
- 3-year position
- 0 means speculators are the most short they've been in three years, 100 the most long. How: Markets at 90+ or 10− are labelled as near an extreme.
Reading the numbers
- Inverted yield curve
- Short-term rates above long-term ones. It has often come before recessions, but with long and uneven delays.
- Core inflation
- Inflation without food and energy, which jump around.
- Speculators and hedgers
- In the CFTC report, non-commercial traders (mostly funds) and commercial traders (producers and users hedging business risk).
Tips
- Check the Daily tab's economic calendar for when the next CPI or jobs report comes out.
- Crowded positioning can unwind fast when news surprises, but it can also stay extreme for months.
Common mistakes
- Reading one month's number as a trend.
- Using positioning extremes as buy or sell signals on their own.
Limits to know
- Use Settings → Display → Reduce transparency for opaque surfaces.
- Economic data refreshes every 6 hours and positioning every 12; agencies revise past numbers.
- Positioning is as of each Tuesday and published on Friday.
- Only government series are shown; privately owned data (credit spreads, the VIX index, consumer sentiment, mortgage rates) is left out for licensing reasons.
- Sources: FRED (Federal Reserve Bank of St. Louis) from the agencies named on each card, the U.S. Bureau of Labor Statistics, and the U.S. Commodity Futures Trading Commission.
- If a month wasn't collected (for example during a government shutdown), comparisons use the same calendar month and show a dash rather than guessing.
- Each section carries a data label with its source. If a source does not load, that section says what failed and offers Try again.
Try it: Compare CPI with core CPI over the last two years, then check where speculators sit in gold and the 10-year note.
Lebs is for education and research, not investment advice, and it places no orders.