

Step by step
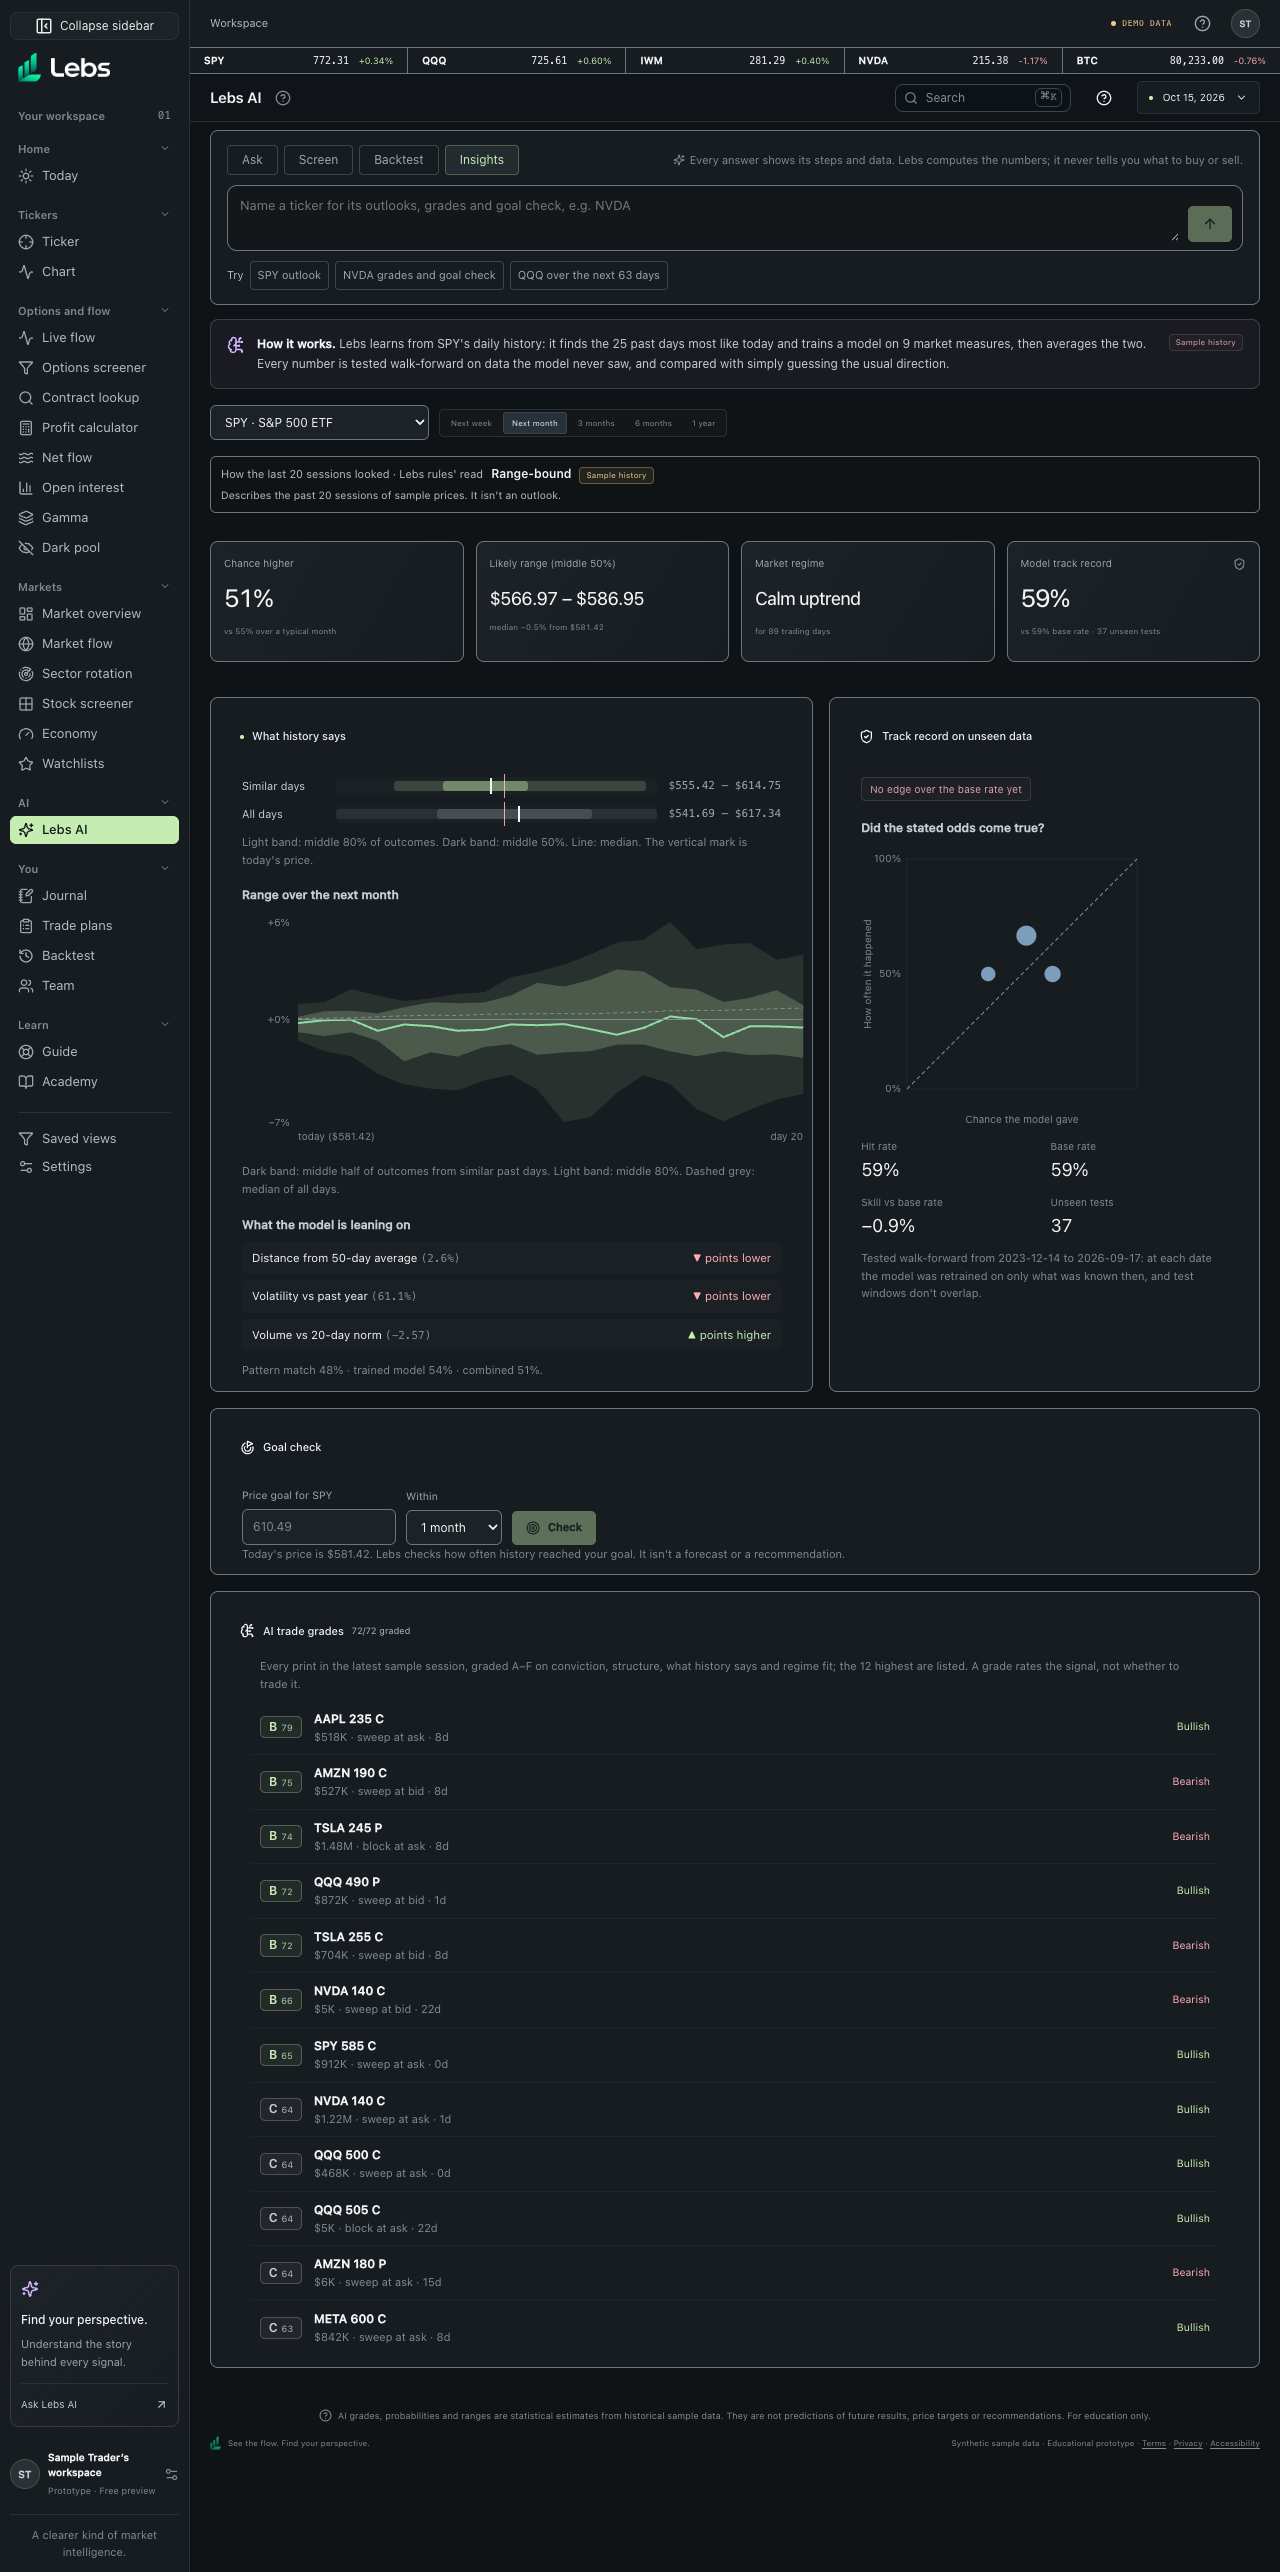
- Open Lebs AI. Pick a mode with the chips above the prompt box: Ask, Screen, Backtest or Insights. The address follows the mode (#lebs-ai/screen and so on).
- Type in the prompt box and press Enter, or click one of the three examples under it.
- Ask: read the answer and the line under it naming the data's source and time and who sorted your question (Jev or Lebs rules). Lebs AI explains; it never tells you to buy or sell. A question asking what to buy or sell, or for a price target, gets a short reply saying so and a link to the Academy. A question that's really a stock screen or a backtest offers Run this in Screen or Test it in Backtest with your words filled in.
- In Insights, 'How the last 20 sessions looked' describes the ticker's recent sample prices (steady uptrend, range-bound, choppy and so on). It describes the past; it isn't an outlook.
- Screen: read 'What Lebs will do' (each filter it understood), 'What it can't answer', then the matches as a Table or as Charts.
- Backtest: check the strategy Lebs built and edit it if needed, set the costs per side, and read the steps, the result card (full history, last 10 and last 5 years, after costs, beside buy-and-hold), the charts and the trades. 'Pairs: SPY vs QQQ' runs a pairs trade. An idea that names a chart such as 'two-hour' runs on simulated intraday bars and says so.
- Intraday strategies: an idea with an opening range or a moving-average cross, such as 'opening range breakout with an EMA cross, 3 to 1, only above the 200-day average', opens the strategy test. Read the rules in plain English and every assumption Lebs made from your words, change the ticker, target or years if needed, then click Run this test. Nothing runs until you do. Read the trades, win rate, average R, expectancy, worst drawdown and total return beside buy-and-hold; the equity and drawdown chart; the last 5 and 10 years; and the trade list. It runs on simulated bars until there's an intraday data plan, and says so.
- Insights: name a ticker (or pick one) and a horizon; read the likely range, the track record on unseen data and the goal check.
Every control, explained
- Prompt box
- One box for every mode; up to 500 characters. How: Enter runs it; Shift+Enter adds a line.
- Mode chips
- Ask, Screen, Backtest and Insights. How: Click one; the address and the examples change with it.
- Examples
- Three prompts per mode that run end to end on the demo workspace. How: Click one to run it.
- Ask
- Plain-English answers about the sample session, with the data's source and time under each answer. How: Without a connected AI service, answers come from Lebs' written templates and say so.
- Question sorting (Jev)
- Before answering, Jev (TypeSafe AI's decision model) sorts the question: why something moved, something on screen, your journal, a stock screen, an idea to test, a concept, an advice request or off topic. Without Jev, Lebs' rules do the same and the answer says which. How: Advice requests get the no-advice reply; screens and tests get a button to the right mode.
- Answer check
- When Claude writes an answer, Jev checks whether it tells you to trade or gives a target; if so, the answer is replaced with the no-advice reply and marked. How: Nothing to do.
- How the last 20 sessions looked
- A one-line description of the ticker's last 20 sample sessions, with Jev's confidence, or 'Unclear'. Built from returns, volatility, moving averages and up days. How: Shown under the Insights controls; changes with the ticker.
- Screen
- Plain-English screening over stock and crypto data, with the plan shown and the limits stated. How: Choose Table or Charts; the Charts view shows 12 daily candle cards per page. Click a row or card to open it in Chart.
- Strategy test
- Opening-range breakouts and EMA or SMA crosses on intraday bars, with filters (a time-of-day window, above or below a daily average), stops at the opening range, an ATR multiple or a percent, a target in R ('3 to 1' = 3R), a time stop, fees and slippage. Results: trades, win rate, average R, expectancy, worst drawdown, equity against buy-and-hold, the last 5 and 10 years and every trade. Runs on simulated bars built from daily sample history. How: Describe the strategy in Backtest, check the rules and assumptions, then Run this test. Past results don't predict future results.
- Backtest
- A plain-English idea turned into a strategy you can edit, then run on past prices with trades, win rate, average return, worst drawdown and buy-and-hold, after costs, for the full history and the last 10 and 5 years. How: Edit the rules or the costs and click Run test to run again.
- Named strategies
- 'Pairs: X vs Y' runs Strategy lab's pairs trade: hedge ratio and z-score from past days only, with stated entry, exit and stop rules. How: Type 'Pairs:' and two sample tickers.
- Simulated intraday
- Ideas that name a 5-minute, 2-hour or similar chart run on simulated bars built from daily prices. How: A warning says so; rule lengths count bars and the hold converts days to bars.
- Outlooks
- Ranges and probabilities for 5, 20, 63, 126 and 252 trading days. How: Pick a horizon; long horizons have few independent examples and say so.
- What history says
- Similar past setups (analogs) and what followed. How: Read the list.
- Model drivers
- Which inputs the model leans on. How: Read the bars.
- Track record on unseen data
- Walk-forward test results against baselines, and whether the stated odds came true. How: Read the calibration chart.
- Goal check
- How often a target was reached by the close within a time frame. How: Enter target and time frame.
Reading the numbers
- After costs
- The cost per side (fees, spread and slippage, in basis points) comes off every entry and exit, and off buy-and-hold's one round trip. 5 basis points is 0.05%.
- Worst drawdown
- The biggest drop from a peak in the strategy's value along the way.
- Walk-forward test
- The model is trained on the past, tested on the next period it never saw, then rolled forward. It's the honest way to test.
- Baseline
- A simple rule (such as 'always predict the usual direction') the model must beat to be useful.
Tips
- Change one rule at a time and rerun, so you know what made the difference.
- Compare the last 5 years with the full history: a rule that only worked long ago may have stopped working.
Common mistakes
- Reading a 60% outlook as a sure thing: 4 times in 10 it goes the other way.
- Trusting a backtest with few trades; the screen warns under 20 and under 50.
Limits to know
- Backtests and outlooks run on 15 years of synthetic sample history, so their numbers teach the method rather than forecast real prices. Sample histories are generated separately per ticker, so pairs show the method, not a real relationship.
- Intraday ideas use simulated bars, not real intraday prices.
- When ANTHROPIC_API_KEY is set on the server, Claude reads ideas into strategies; otherwise a rule-based parser does. Either way, Lebs' own code computes every number.
- Jev sorts and describes; it never predicts. It needs a TypeSafe key on the server; without it, Lebs' rules answer the same questions and say so.
Try it: In Backtest, run 'Buy SPY after a 2% down day, hold 5 days', then change the costs to 20 basis points and compare the last 5 years with buy-and-hold.
Lebs is for education and research, not investment advice, and it places no orders.