

Step by step
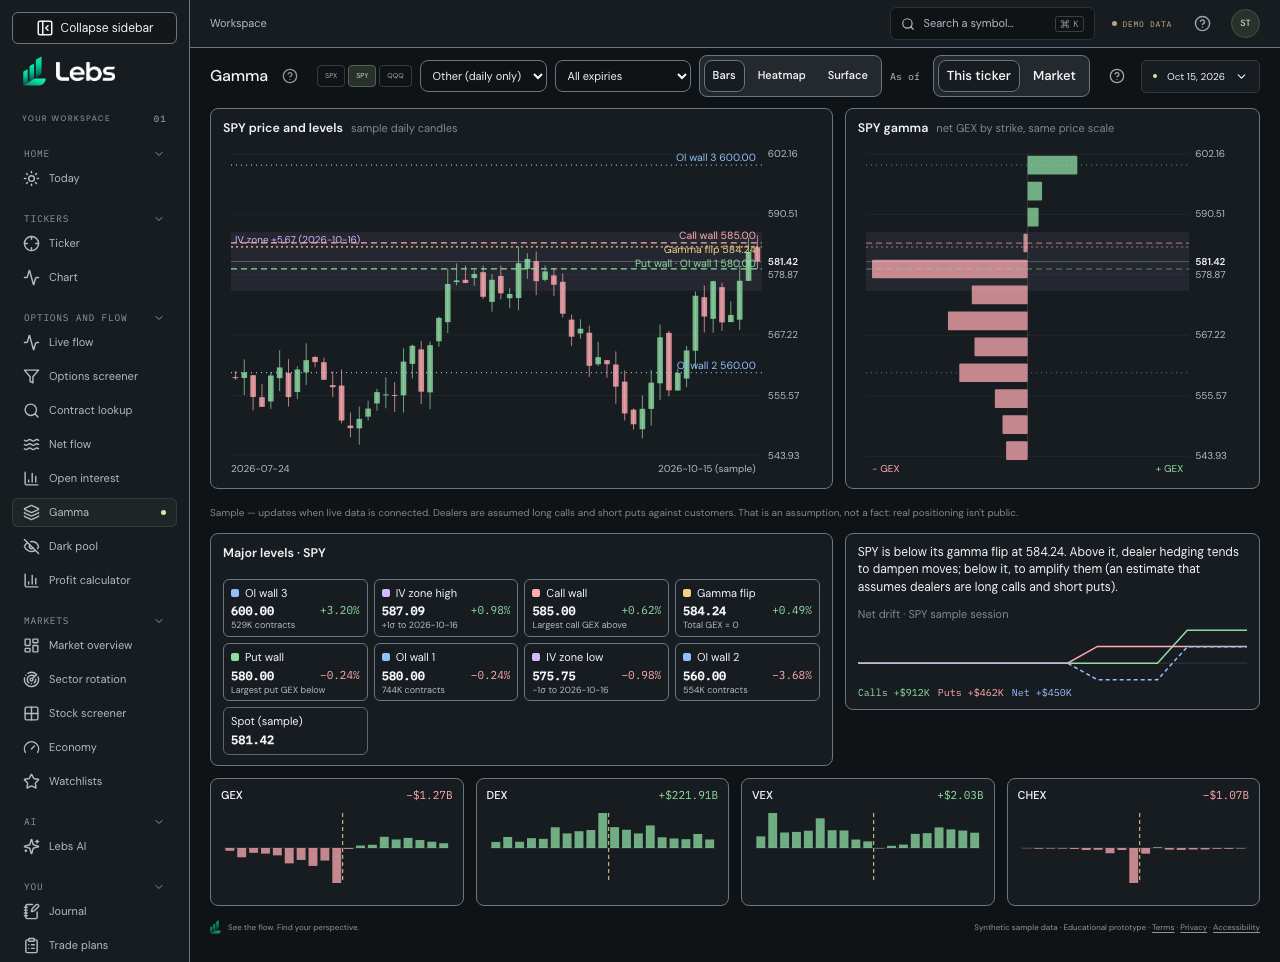
- Open Gamma. Choose This ticker or Market in the page header. This ticker follows the workspace symbol; Market opens the sample basket with its own scope, ticker and session controls. Switching back preserves the ticker's expiry and chart view.
- In This ticker, pick SPX, SPY or QQQ in the page header, or another sample ticker from 'Other (daily only)'. The ticker terminal switches together.
- Choose an expiry, or keep All expiries. The walls, flip, levels table and small charts recompute for that expiry; the IV zone uses it too.
- Read the two main panels: the sample session's daily candles with the levels on the left, and the gamma on the right in its own panel: net GEX by strike (Bars, on the same price scale as the candles) or a table of net GEX by strike and expiry (Heatmap), with every cell's dollar value, an All column with each strike's total, and a line where spot sits. Surface draws the heatmap's numbers in 3-D: strikes left to right, expiries front to back, height for net GEX; drag it, use the arrow keys or the buttons to turn it. Dashed lines mark the call wall (red), put wall (green), gamma flip (amber) and OI walls (blue); the shaded band is the IV zone.
- Read Major levels along the bottom: each level's price, its distance from spot in percent, and its type; beside them, the positioning line and the net drift of the session's trades. The screen sizes itself to fit the window without scrolling; a tall heatmap scrolls inside its own panel.
- Click any of the four small charts (GEX, DEX, VEX, CHEX) to enlarge it. GEX's enlarged view adds the exposure forecast for the coming days. Press Escape or Close to return.
Every control, explained
- Exposure mode
- This ticker shows the existing ticker terminal; Market shows exposure across the sample basket. The Ticker page's compact Gamma embed stays on its own symbol. How: Use This ticker | Market in the Gamma header. Tab to the control and use the arrow keys to switch. Market has its own scope and optional ticker without changing the shared workspace symbol.
- Ticker chips
- SPX, SPY and QQQ, the symbols planned for live updates; other sample tickers are labeled 'daily only'. How: Click a chip or choose from Other.
- Expiry filter
- All expiries, or one expiry including today's (0DTE). How: Everything on the screen uses the chosen expiry.
- View switch
- Levels (candles beside net GEX by strike, with the major levels below) and Heatmap (a full-width table of net GEX by strike and expiry, with the dollar value in every cell, a total per strike, sticky strike and expiry headings and the spot row marked). How: Levels | Heatmap in the controls; links #gamma and #gamma/heatmap. The expiry picker outlines that column in Heatmap. The All column equals the strike's bar in Levels.
- 3-D view (advanced)
- On the Heatmap view, the same strike × expiry numbers as a 3-D surface: green peaks above the floor are positive, red dips below are negative. Height uses a square-root scale so one large strike doesn't flatten the rest; color and hover show the real values. Spot, the walls and the flip run across the floor; a chosen expiry is outlined in amber. How: Heatmap › 3-D view (advanced); 'Back to the table' returns. Drag, press the arrow keys (Shift for bigger steps, Home to reset), or use the rotate, tilt and reset buttons. Hover a cell for its numbers.
- Level map
- Sample daily candles with the walls, flip, OI walls and IV zone drawn across, in their own panel; the gamma panel beside it uses the same price scale. How: Hover a candle or bar for its numbers.
- Call wall / put wall
- The strike at or above the price with the most call gamma, and the strike at or below it with the most put gamma; often watched as resistance and support. How: Read the labeled lines or the levels table.
- Major levels
- Every level with its type, its distance from spot in %, and the implied odds of the price touching it before the chosen expiry, as cards along the bottom. The odds are what option prices imply (about twice the chance of finishing beyond the level at that expiry's IV), not a forecast, and say nothing about direction. How: Green distances are above spot, red below. 'Most likely to touch' orders the cards by those odds; 'Touch by' picks the expiry.
- Positioning line
- Whether the price is above or below the gamma flip, and what that tends to mean for dealer hedging. How: Read it as a tendency under an assumption, not a forecast.
- Net drift
- Net call (green), put (red) and combined (blue, dashed) premium through the sample session for this ticker. How: Net flow has the full analysis.
- Exposure charts
- GEX, DEX, VEX and CHEX by strike within 8% of the price, with totals. How: Click one to enlarge; GEX adds the exposure forecast.
- As of and Sample badge
- The sample session time (10:42 AM ET, Oct 15, 2026) and a Sample label. On the Ticker page, a note says when the stock's real close is far from the sample chain's price, since the strikes then aren't the stock's real ones. How: Live updates for SPX, SPY and QQQ wait for licensed data.
- Market exposure
- The Market mode totals GEX ($ per 1% move), DEX ($), vanna ($ per volatility point) and charm ($ per day) across the loaded sample chains. All, Index products (SPX, SPY, QQQ, IWM) and Single stocks define the basket. How: Select Market in the Gamma header, then choose a scope, ticker and sample session. All tickers use 1% strike-distance bands from −10% to +10%; one ticker uses its actual dollar strikes. Expiration uses calendar DTE groups (0, 1–7, 8–30, 31–90 and over 90 days), or listed expiry dates for one ticker. Data buttons open accessible tables of exact values.
- Market contributions and history
- Contributions rank tickers by absolute GEX and show their signed share of net GEX. Shares can be negative or exceed 100%; a zero net total is n/m. History reads dated option-chain snapshots, not today's OI applied to old prices. How: Read coverage before comparing. Missing tickers are named, current totals show the loaded subset, and incomplete history stays blank. Only October 15, 2026 is currently available, so history has one point. Distance charts omit strikes outside ±10%; total cards include them. Index products overlap the stocks underneath, so the sum is a sample basket rather than a consolidated market hedge.
Reading the numbers
- GEX
- Gamma exposure: dollars of stock dealers would trade for a 1% move. Positive tends to damp moves; negative tends to amplify them.
- Gamma flip
- The price where total estimated gamma changes sign: above it hedging tends to calm moves, below it to add to them.
- OI wall
- A strike with a lot of open contracts (calls plus puts).
- IV zone
- Spot ± one expected move from at-the-money implied volatility: about 68% of outcomes to that expiry if IV is right.
- DEX, VEX, CHEX
- Delta, vanna and charm exposure: the dollar delta dealers hold, how it changes with volatility, and how it drifts per day.
Common mistakes
- Treating walls as hard barriers; they're estimates.
- Forgetting the convention: every level assumes dealers are long calls and short puts, which real positioning may not match.
Limits to know
- Sample option chain and sample candles from Oct 15, 2026; real levels need real open interest from a licensed feed.
- Dealer positioning isn't public; the levels rest on the long-calls, short-puts assumption.
- Surface draws straight lines between expiries; the real values sit only at listed expiries.
Try it: Find SPY's call wall and how far it is from the price, then switch to QQQ and Heatmap and find the expiry with the most gamma near the price.
Lebs is for education and research, not investment advice, and it places no orders.