

Step by step
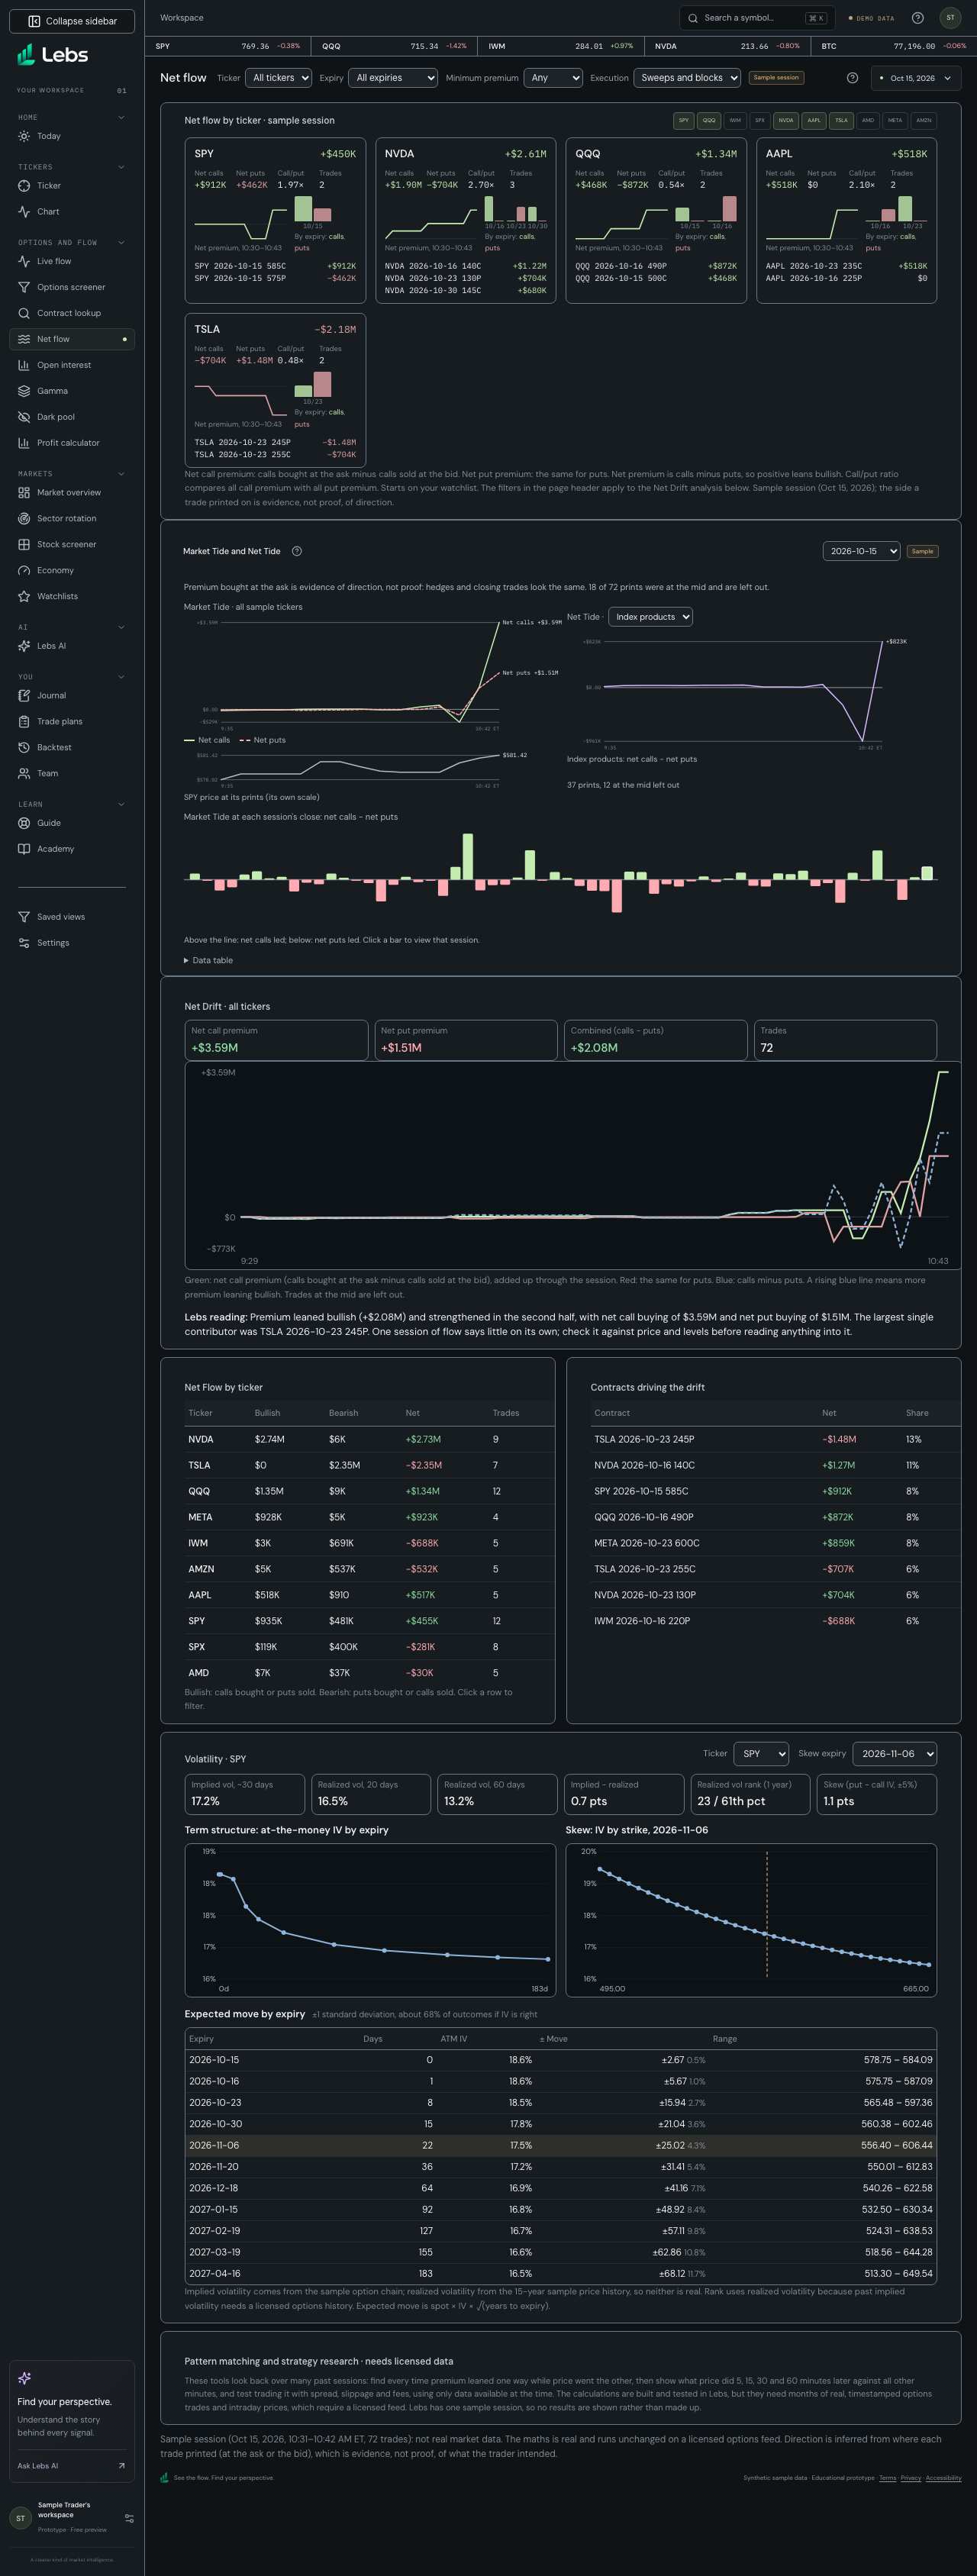
- Open Net flow. SPY, QQQ and the Magnificent Seven (AAPL, MSFT, GOOGL, AMZN, META, NVDA, TSLA) are pinned first, then the rest of your watchlist; click ticker chips to add or remove symbols. Cards read the same sample session as Live flow.
- Read each card: net premium (top right), net call premium, net put premium, the call/put ratio and the number of trades; the line of net premium through the session; premium by expiry (calls green, puts red); and the top contracts.
- Read Market Tide and Net Tide under the cards. Market Tide draws two running totals across every sample ticker: net call premium (solid) and net put premium (dashed), with SPY's price on its own small chart below. Net Tide draws one line, net calls minus net puts, for the group you pick: index products, single stocks, your watchlist, one ticker or a sector. The bars show each session's closing value; click one to open that session. The ? button gives the definitions.
- Below, use the filters in the page header (ticker, expiry, minimum premium, sweeps or blocks) for the Net Drift analysis: green is net call premium, red net puts, blue calls minus puts, added up through the session.
- Read Net Flow by ticker (bullish vs bearish premium) and 'Contracts driving the drift'. Pick one ticker for the Interval Map, the options heatmap, the cross-market check against index flow and real FINRA dark-flow numbers.
- In Volatility, start with 'What the options market shows' (plain sentences, each with its number and what it doesn't tell you), then read term structure, skew and the expected move. Dealer exposure and the exposure forecast are on the Gamma terminal.
Every control, explained
- Ticker cards
- Net call premium, net put premium, net premium, call/put ratio, trades, a session line, premium by expiry and the top three contracts per ticker. How: Ticker chips choose the cards; SPY, QQQ and the Magnificent Seven are pinned first (marked Pinned), then your watchlist.
- Market Tide
- Running net call premium (calls bought at the ask minus calls sold at the bid) and net put premium across all sample tickers through the session. Mid trades are left out and counted. How: Hover for the values at each time; Data table lists them.
- Net Tide
- Net calls minus net puts for one group, as a single line. How: Pick the group above the chart.
- Tide history
- One bar per sample session: Market Tide's closing value, net calls minus net puts. Above the line, calls led; below, puts led. How: Click a bar to view that session.
- Net Drift and Net Flow
- Directional premium over time and by ticker. How: The page-header filters apply to both.
- Interval Map and heatmap
- Where premium landed by strike, time and expiry. How: Pick a single ticker.
- Cross-market check
- Whether index flow (SPY, QQQ, IWM, SPX) leans the same way. How: Read the verdict.
- Volatility
- What the options market shows, in plain sentences, then term structure, skew, expected move and realized vs implied. Each sentence card gives the number behind it and what it doesn't tell you: whether options are priced for bigger or smaller moves than the stock has made, whether puts or calls cost more, whether near-term options cost more than later ones, and the expected move to the next three expiries. It describes prices, never what to trade. How: Read the cards first, then the charts. Expected move = price × implied volatility × √(years to expiry).
Reading the numbers
- Net call premium
- Calls bought at the ask minus calls sold at the bid. Trades at the mid are left out.
- Net premium
- Net call premium minus net put premium. Positive leans bullish.
- Call/put ratio
- All call premium divided by all put premium, whatever the side.
- Expected move
- One standard deviation: about 68% of outcomes if implied volatility is right.
Common mistakes
- Reading one session's net premium as a forecast.
- Treating the side a trade printed on as proof of intent: it's evidence.
Limits to know
- Flow and chains are sample data (the tide covers the 60 sample sessions; the rest the Oct 15, 2026 session); the dark-flow panel is real FINRA data from a different date.
- Market Tide and Net Tide use Lebs's own definitions until our pilot trader confirms his; they move to the Market flow page when it's built.
- Pattern matching and strategy research over many sessions need a licensed feed and say so.
Try it: Add NVDA to the cards, find its largest contract, then pick NVDA in the header and check which contract drove most of its drift.
Lebs is for education and research, not investment advice, and it places no orders.