

Step by step
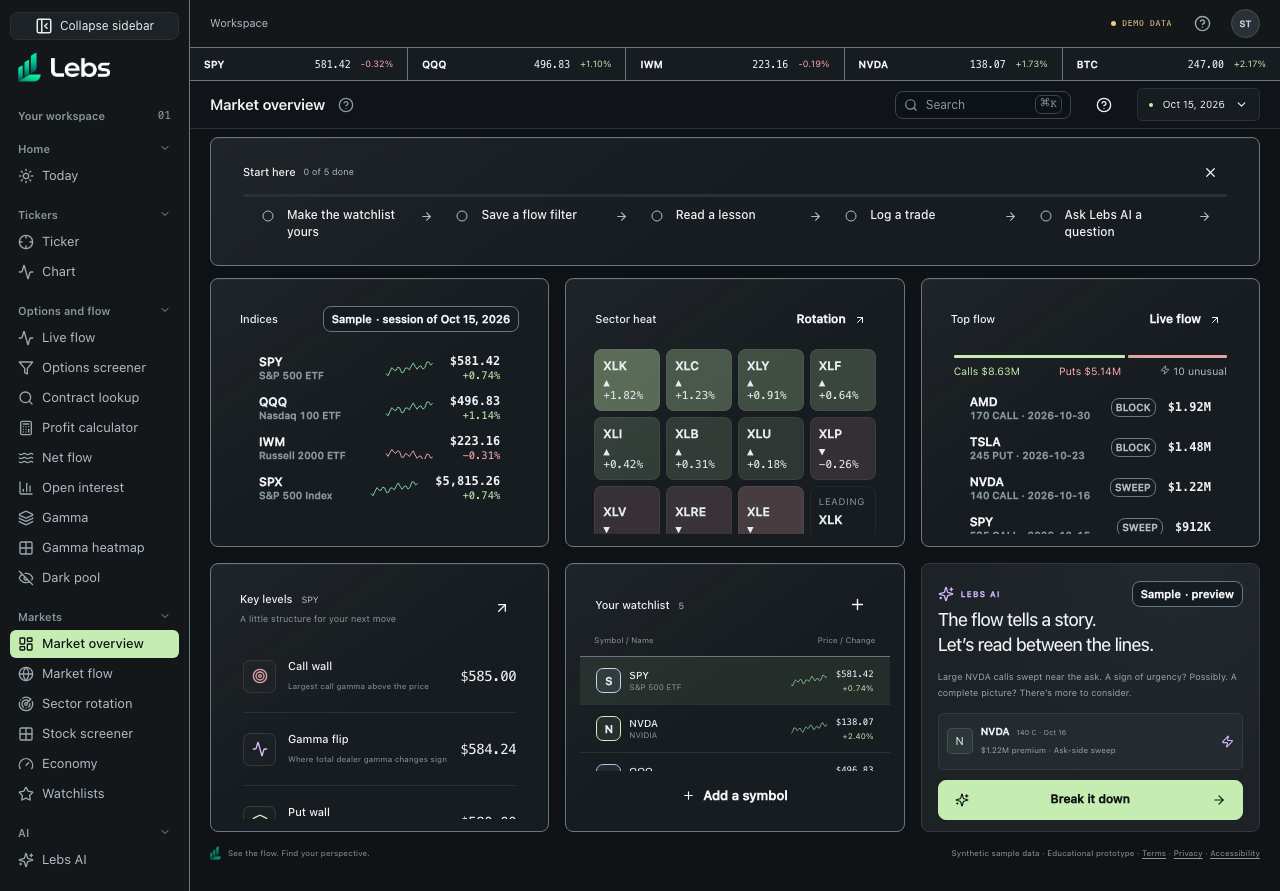
- Open Market overview (in the Markets group). New accounts see a Start here checklist on top; once three of its five tasks are done it shrinks to one line, with Show all to open it again.
- Read the top row: Indices (SPY, QQQ, IWM and SPX), Sector heat (all eleven sectors as tiles, green rising and rose falling) and Top flow (the biggest flagged options trades by premium, with the split between calls and puts).
- Read the bottom row: Key levels for the chosen ticker, your watchlist and the Lebs AI preview.
- Click anything for more: an index opens its Ticker page, a sector tile opens Sector rotation, a trade opens its explanation. A panel with a long list scrolls inside itself.
Every control, explained
- Start here
- Five first tasks that tick themselves off. After three are done the card is a single line showing the next task. How: Click a task to do it, Show all to see every task, or the x to hide the card for good (Settings brings it back).
- Indices
- SPY, QQQ, IWM and SPX with a small price line, the sample-session price and the change. How: Click a row to open its Ticker page.
- Sector heat
- Illustrative daily change by sector as colored tiles, with the leading sector at the end. How: Click a tile to open Sector rotation with that sector selected.
- Top flow
- The eight biggest sample options trades by premium, with call and put premium and how many were flagged unusual. How: Click a trade for its plain-English explanation and grade.
- Levels
- Call wall, gamma flip and put wall for the chosen ticker, estimated from the sample option chain (the same numbers as Gamma and the chart overlay). How: Compare the price with the nearest levels above and below.
- Watchlist
- Your followed symbols with their sample-session prices. How: Click to select; edit from Watchlists.
Reading the numbers
- One reported options trade.
- Unusual
- Larger or more aggressive than normal for that contract; a clue to look closer, not a signal to copy.
Tips
- Use Market overview to learn the vocabulary of options flow before using the Live flow screen.
Limits to know
- Use Settings → Display → Reduce transparency for opaque surfaces.
- Everything on Market overview is sample data from Oct 15, 2026; it shows how the tools work, not today's market.
Try it: Click the biggest trade in Top flow and read why it was flagged, then click the leading sector tile.
Lebs is for education and research, not investment advice, and it places no orders.