

Step by step
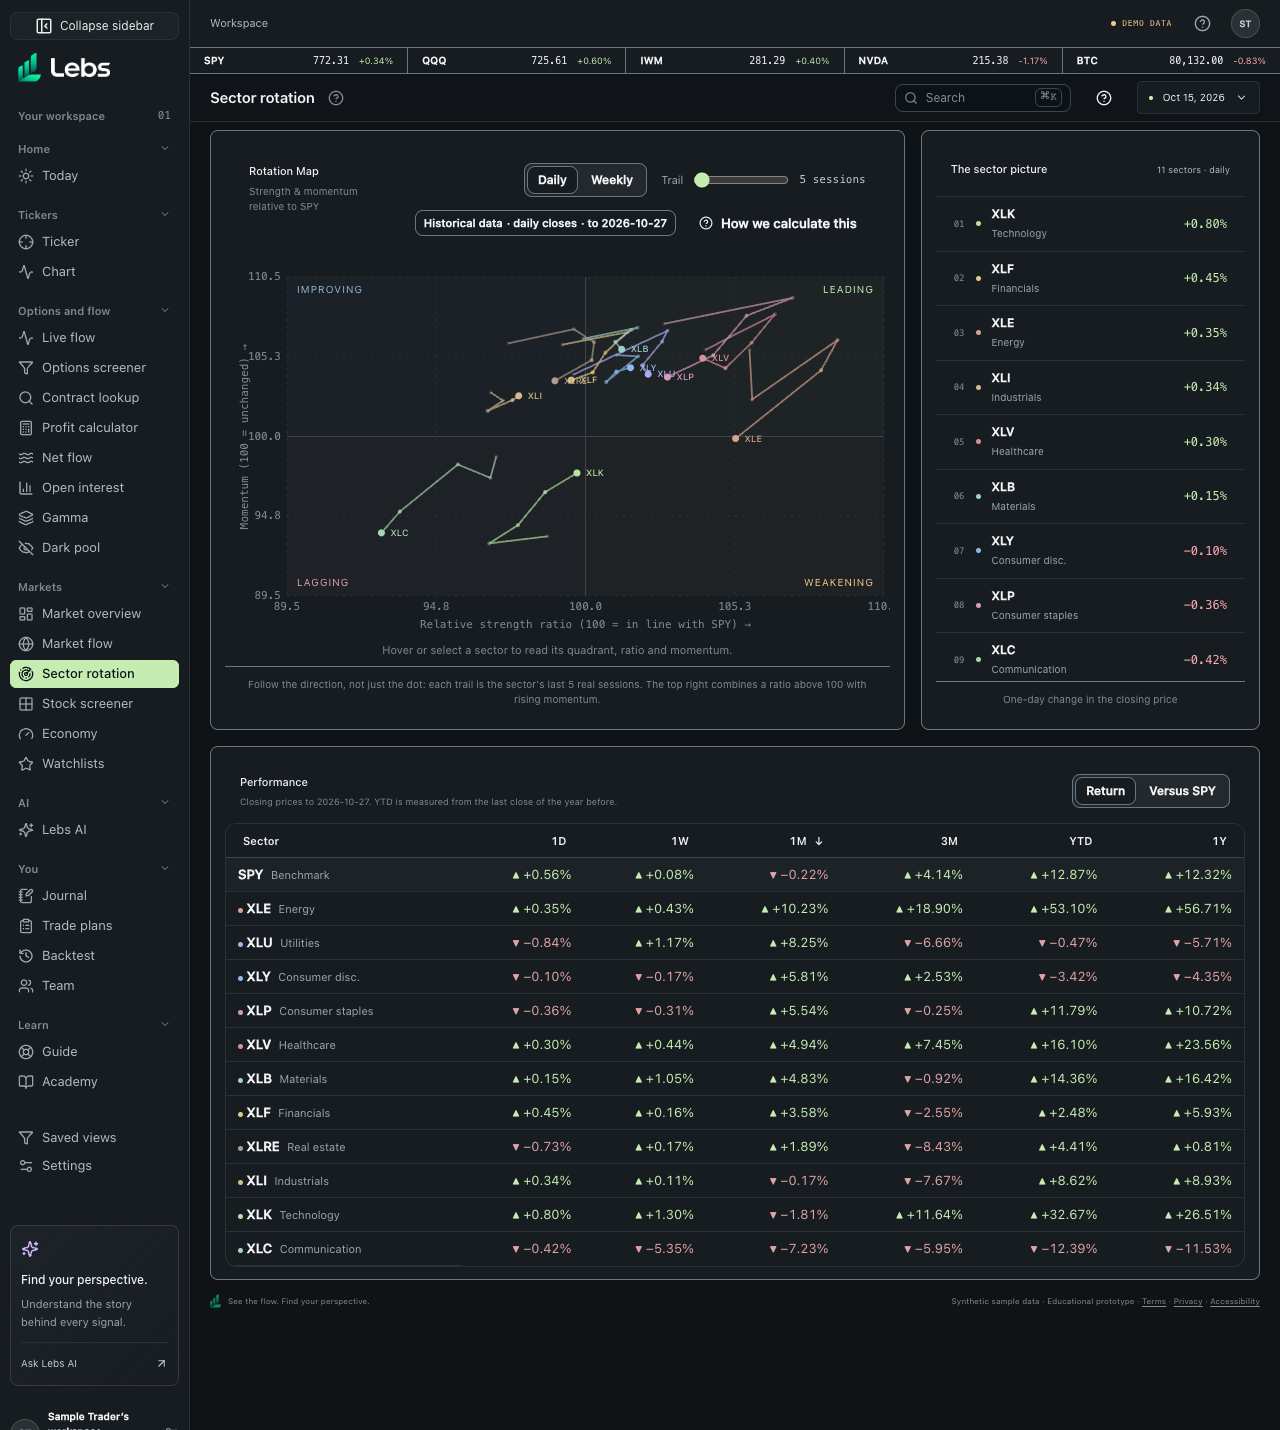
- Open Sector rotation. The prices load one fund at a time, SPY first, so a status line counts them and the map fills in as each sector arrives. When a fund has too little history for the view, the note under the map names it.
- Read the Rotation Map. Right of the middle line means the sector is stronger than its own recent average against SPY; above the middle line means that strength is rising. The four corners are Leading (top right), Weakening (bottom right), Lagging (bottom left) and Improving (top left).
- Choose Daily or Weekly at the top of the map. Weekly uses the last close of each week, so each step of a trail is a week instead of a day.
- Drag the Trail slider from 5 to 10 periods. Curved trails pass through the observed points and end in an arrow showing the latest direction; turn Curved off for straight lines.
- Hover or Tab to a sector on the map to read its quadrant, ratio and momentum under the map. Click it, or press Enter, to expand its holdings in the sector list; select it again to close the list.
- Select a sector dot or list row to expand its top five fund holdings under the row. Weights link to the dated State Street snapshot; prices are daily closes, with sample prices labeled when a provider is unavailable.
- Open How we calculate this for the formulas. Then read the Performance table under the map: returns for 1D, 1W, 1M, 3M, YTD and 1Y. Click a heading to sort, and switch to Versus SPY to see each sector's return minus SPY's.
Every control, explained
- Rotation Map
- Relative strength ratio (horizontal) and momentum (vertical) against SPY, both centered on 100, drawn to fill its panel with a real trail behind each sector. How: Read the corner and the trail direction. The ticker labels use the text color for readability; colored dots and trails identify the sectors.
- Daily / Weekly switch
- Whether each step of a trail is a day or a week (the last close of the week), and whether the list shows the one-day or one-week change. How: Click Daily or Weekly. Daily averages 50 sessions with a 10-session momentum; weekly averages 10 weeks with a 4-week momentum.
- Trail length
- How many real periods of each sector's path the map shows, from 5 to 10. How: Drag the slider; the label says how many sessions or weeks.
- Quadrant readout
- The quadrant, ratio and momentum of the sector you hover, focus or select. How: Hover a dot or Tab to it. The same words are the dot's accessible name.
- How we calculate this
- The formulas in plain words: relative strength, ratio, momentum and the quadrant rules. How: Click the button; Escape closes it.
- Sector list
- All eleven sectors ranked by the change in the closing price for the view: one day for Daily, one week for Weekly. How: Click to select; scroll inside the panel. A dash means the prices have not loaded yet.
- Fund holdings
- The five largest holdings from State Street’s dated fund snapshot, with fund weight, last close, day change, and the holding’s return and difference versus the fund over the trail dates. How: Select a sector on the map or in the list. A dash means a required close, matching date, or comparable data source is unavailable; sample prices carry a Sample badge.
- Performance table
- Returns for 1D, 1W, 1M, 3M, YTD and 1Y per sector, with SPY at the top, from the same real closes as the map. How: Click a heading to sort and again to reverse. Every number carries a + or − sign as well as a color.
- Return / Versus SPY
- Switches the table between each sector's return and its return minus SPY's, in percentage points. How: Click Return or Versus SPY.
- Data label
- Says where the numbers come from: real daily closes with the date of the last one, or Sample when the map is illustrative. How: Hover the label for the data source or the reason the map is illustrative.
Reading the numbers
- Relative strength
- The sector fund's close divided by SPY's close. It rises when the sector does better than the market.
- Ratio
- 100 × relative strength ÷ its simple average over the last N periods. Above 100: stronger than its own recent average against SPY.
- Momentum
- 100 × the ratio ÷ the ratio M periods ago. Above 100: the ratio is rising.
- Leading, Weakening, Lagging, Improving
- The four quadrants around 100 on both axes. Exactly 100 counts as the strong side.
- Versus SPY
- The sector's return minus SPY's return over the same window, in percentage points.
Common mistakes
- Reading the dot without its trail: direction matters more than position.
- Treating a quadrant as a forecast. It describes what already happened.
Limits to know
- Use Settings → Display → Reduce transparency for opaque surfaces.
- The map is calculated from real daily closes only when a stock price provider is connected and every fund's prices arrive. Otherwise it keeps the illustrative map, labeled Sample, with the reason.
- A fund needs enough history for the view: 60 aligned closes for the first daily point (64 for a 5-point trail) and 14 for the first weekly point. Recent listings can be too short, and the note under the map says so; a table window older than a fund's history shows a dash.
- Prices load one fund at a time under the provider's shared request limit, so on a limited plan the first open can take a few minutes. Prices already loaded for a chart are reused.
- A day counts only when both the fund and SPY have a close; missing days are left out, not filled. The latest week counts with its last close so far.
- Holdings are a dated State Street snapshot and can change. If a source is unavailable the sector says Holdings not loaded. Comparisons require closes at both trail endpoints and matching real or sample sources; an illustrative map compares the latest available price periods.
- Rotation alerts use their own, separately versioned calculation (a 20-period average and a five-period change), so an alert's quadrant can differ from the map's.
Try it: Switch to Weekly, set the trail to 10, hover the sector whose trail is moving from Improving towards Leading, then sort the Performance table by 3M.
Lebs is for education and research, not investment advice, and it places no orders.